Zabbix and Icinga are both great examples of what Open Source Network Management software can achieve when communities of developers and users get behind their projects and drive innovation.
Each one of these Network Monitoring suites offers the features and functionality that you would expect to find in a high-end, enterprise version of software.
Instead, these applications are freely available for download, and can be setup and installed in a relatively short space of time.
The only real limiting factor is how much time you are willing to put into the overall configuration of each system, and as we know, time equals money, especially if you are a busy person with a lot on their plate.
Let’s take a brief overview of both of these products, and find how they compare against one another.
Zabbix

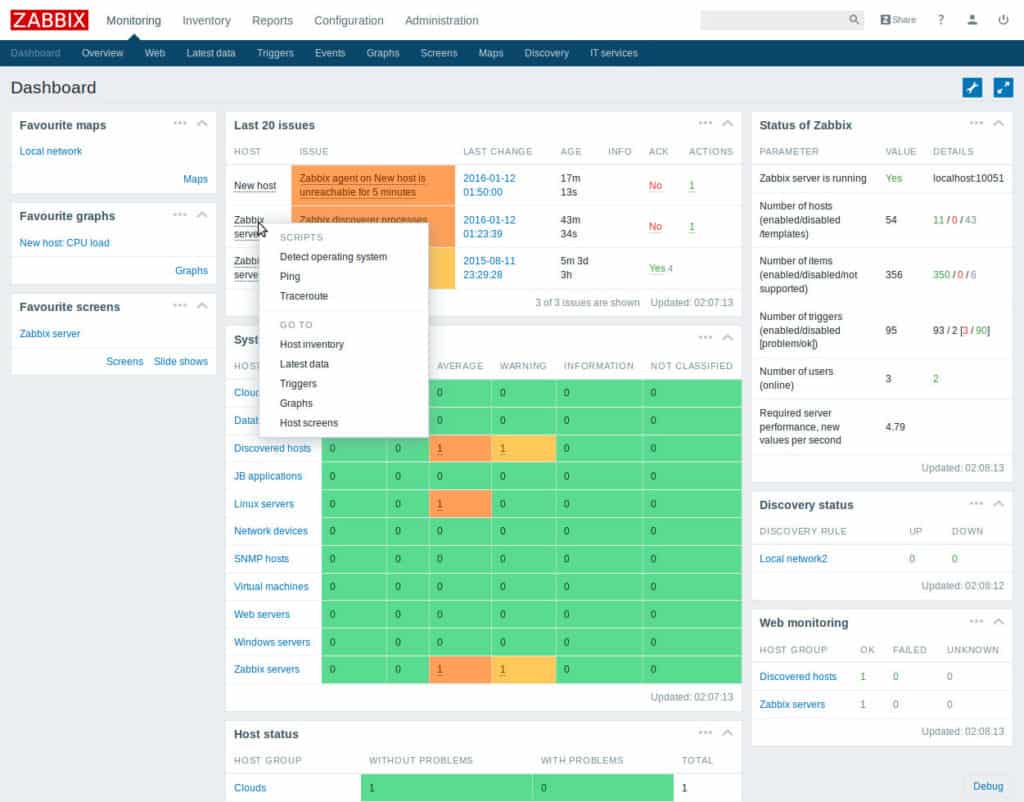
Zabbix is a highly scalable platform that can do just about anything that you need it to, and then some. There are agents that constantly run, giving you a clear and comprehensive view of what is happening on your network. A massive reporting and data collection element also takes center stage giving you a deep pool of data to dive into if you ever need to perform any system analysis.
As mentioned earlier, scale is one of the main features that Zabbix can offer your business, enabling you to roll out your monitoring facilities as fast as you need them, and thanks to the fact that Zabbix is free, you don’t have to worry about additional licensing costs. Zabbix scales in a way that allows it to handle thousands of concurrent devices, 24/7. Scripts and additional customizability allow you to make each instance of Zabbix your own purpose built monitoring solution.
Zabbix agents use both SNMP as well as IPMI agents to grab data over your network, which will allow you to see what resources are being used on your network at any given moment, especially handy if you have tens or even hundreds of servers and network appliances to monitor.
Local instances are not the only system types that Zabbix can monitor either, as Cloud services and Containers can also be closely scrutinized via the system console. Other staples that can be effectively monitored include Virtual Machines, system hardware, services, databases, applications and even more. Zabbix can be downloaded from here!
Additional Zabbix Features:
https://www.zabbix.com/auto_discovery
https://www.zabbix.com/features
https://www.zabbix.com/zabbix_agent
https://www.zabbix.com/snmp_ipmi_agent
https://www.zabbix.com/agentless_monitoring
https://www.zabbix.com/custom_monitoring
https://www.zabbix.com/calculated_and_aggregate
https://www.zabbix.com/web_scenarios
Pros:
- Open-source transparent tool
- Uses both SNMP and ICMP for a broader monitoring range
- Can detect new devices and configuration changes immediately
- Offers useful templates for quick insights
- Robust notification system supports SMS, email, custom script, and webhook
Cons:
- The interface isn’t as intuitive as solutions such as DataDog or Site24x7
- Would like to see better-alerting features, specifically related to reducing false positives
Now onto to Icinga!
Icinga

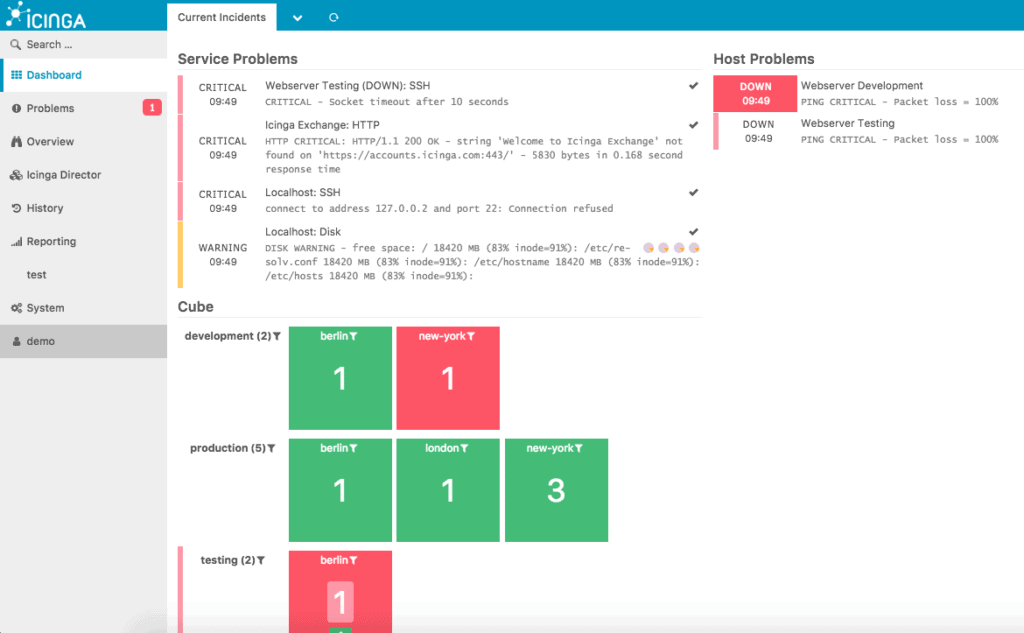
Icinga 2 uses SNMP to gain information about the devices on your network, and it uses an agent to achieve this. It also manages to capture data via SSH, NSClient++, NSCA-NG and NRPE, meaning that both Windows and Linux systems can be monitored and reported on just as easily.
Getting started with Icinga 2 is as easy as following this link here and following the instructions for your particular distribution or operating system. From there, you will be able to customize the types of information that you want to monitor about your network and the systems on your network.
Icinga also offers an API called REST, which allows developers to create applications that can communicate directly with Icinga and the systems on your network, or simply integrate Icinga with your workflow software. For those needing support, you can request a quote from this link here.
Icinga Additional Features
https://www.icinga.com/products/icinga-2/
https://www.icinga.com/products/icinga-web-2/
https://icinga.com/docs/icinga-web/latest/doc/08-Modules/
https://www.icinga.com/products/cloud/
Pros:
- Open-source transparent tool
- Simple, yet informative interface
- Flexible alerting options support SMS and email
- Robust API backend makes it a great option for developers who want to integrate their own custom applications
- Very generous two-month trial period
Cons:
- Open-source version lacks quality support found in paid products
- Installation can be technical and complex
Below you'll find a quick breakdown of the differences and support each software has to offer!
Related Post: Nagios vs Icinga Comparison
Zabbix vs Icinga in 2025: What are the main Differences?
|
Zabbix |
Icinga |
|
| Network Scanning, Auto Discovery, Mapping & Visualization Maps |
✔ |
✔ |
| WMI ICMP SNMP |
✔ |
✔ |
| DB Functionality and Alerts |
✔ |
✔ |
| SLA Monitoring |
✔ |
✔ |
| Hardware Monitoring |
✔ |
✔ |
| Web Server Monitoring |
✔ |
✔ |
| Active Directory Alerts and Monitoring |
✔ |
✔ |
| Reports and Graphs of Historic Trends |
✔ |
✔ |
| Smart Device App: iOS, Android |
✔ |
✔ |
What we have here then, is an almost dead heat. The fact that both of these packages are free to download and use on your network is incredible if you had to itemize the features and functionality that both of these systems can bring to your monitoring game.
Both of these applications offer an enterprise level of support which you must pay for, but depending on the setup that you inhabit, this may or may not be a necessary expense.
Both products offer integration options, but to different applications. Below we can see what Icinga offers in terms of workflow integration:
- Puppet
- Vagrant
- Ansible
- Chef
- Graylog
- Graphite
- InfluxDB
- Elastic
- Terraform
As opposed to Zabbix:
- PagerDuty
- OpsGenie
- Ez Texting
- Flowdock
- CloudMonix
- OverOps
- CoreStack
- ManageEngine AlarmsOne
- BigPanda
It is therefore important for you to choose a product that matches with this requirement, if need be. It is always tough trying to make recommendations based on hypothetical scenarios, but we will do our best.
When it comes to functionality and features, Icinga offers a lot when one considers how many APIs and systems integrations they offer. The core technologies that they built from, namely the Nagios system, give Icinga a sturdy framework that it is able to leverage very nicely.
Zabbix on the other hand seems to offer just as much in terms of versatility and functionality, as it is able to run Nagios plugins! This means that the core functionality that Nagios offers through its plugin set is available to Zabbix users as well.
The trade-off is that there is somewhat of a steep learning curve when it comes to the initial setup and installation of these services.
So, who wins? Unfortunately, it isn’t that simple in this instance, as we have two systems that are very similar to one another in many ways, but also very different in other ways. Both systems are free and open source, which is a plus in both respects, but both are also quite difficult to setup, especially if you are a first time Linux user.
However, if you are willing to stick it out and learn to use the features of either one of these monitoring suites, then it is almost certainly going to be time well spent.
Happy learning and good luck!
Zabbix vs Icinga FAQs
What are some key differences between Zabbix and Icinga?
Zabbix is known for its user-friendly web interface and its ability to monitor a wide range of devices and applications. Icinga, on the other hand, is known for its flexibility and extensibility, as well as its powerful alerting and reporting capabilities. Icinga also has a more active community of contributors and developers.
What types of monitoring can Zabbix and Icinga perform?
Both Zabbix and Icinga can perform a variety of monitoring tasks, including server monitoring, network monitoring, application monitoring, and cloud monitoring, among others.
What types of alerting and reporting capabilities do Zabbix and Icinga have?
Zabbix has a powerful alerting engine that can send alerts via email, SMS, or other methods, and can escalate alerts based on predefined criteria. It also has a range of reporting options, including dashboards, graphs, and tables. Icinga also has a flexible and customizable alerting engine, as well as a range of reporting options, including PDF and CSV reports.
What types of plugins and integrations are available for Zabbix and Icinga?
Both Zabbix and Icinga have a range of plugins and integrations that can extend their functionality, including plugins for monitoring specific applications and devices, as well as integrations with other tools and platforms.
How do Zabbix and Icinga compare in terms of performance and scalability?
Zabbix is known for its high performance and scalability, with the ability to monitor large and complex environments with thousands of devices and millions of metrics. Icinga is also highly scalable and can be customized to meet the specific needs of an organization.


