In today's complex digital world, it's not always possible to test applications, user behavior, configuration, etc. in real time. This is where simulation helps. There are many types of simulations available, depending on what you want to test. One such kind of simulation is synthetic monitoring. Below we list some of the best synthetic monitoring tools available today.
Here is our list of the best synthetic monitoring tools:
- ManageEngine Applications Manager – EDITOR'S CHOICE Provides synthetic web transaction monitoring with real browsers as part of a wider bundle of application monitoring systems with alerts for performance issues. Runs on Windows Server, Linux, AWS, and Azure. Get a 30-day free trial.
- Site24x7 Synthetic Monitoring – FREE TRIAL Continuously tests the availability and functionality of all your critical components for an improved user experience. Start a 30-day free trial.
- Datadog Synthetic Monitoring Can be used to create tests that simulate user transactions on your applications and test the performance of your network endpoints.
- SolarWinds Web Performance Monitor A SaaS tool for monitoring the performance of your websites and identifying the internal and external causes of errors.
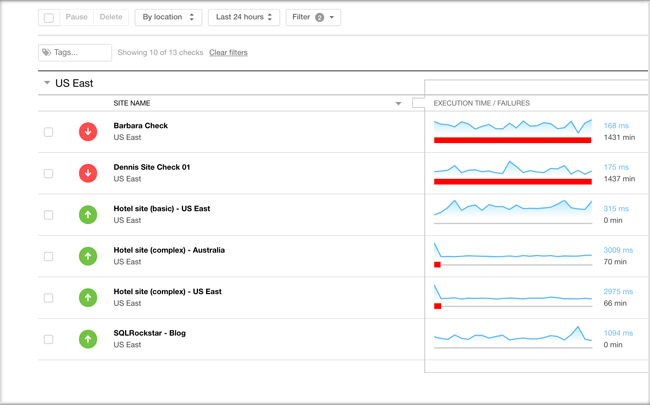
- Pingdom Synthetic Monitoring An easy-to-use tool for simulating the interactions that users have with your website.
- Sematext Synthetics Monitors the availability and performance of APIs and websites from multiple locations around the world.
What is Synthetic Monitoring?
Synthetic monitoring is a type of software testing that mimics user behavior and network traffic. Using the results of this testing, you can monitor the performance and availability of web applications, APIs, and other digital services.
Typically, in synthetic monitoring, a script or a set of scripts is used to create simulated user interactions and transactions. Some possible actions that synthetic monitoring can capture are logging and sending requests to the user. The idea behind writing these scripts is to simulate real-world scenarios as much as possible. Also, you can run these scripts from any location or device to replicate the behavior of real users.
The purpose of synthetic monitoring is to proactively identify issues before they affect real users. More importantly, by running the script from different locations and devices, you can better understand how network availability and the operating system impact the user experience. It can also help identify potential issues with network infrastructure, third-party services, or application code. In some cases, you can use synthetic monitoring to baseline and benchmark different metrics.
In managed services, synthetic monitoring is used to benchmark performance against service-level agreements (SLAs) and measure the impact of changes on your application or service.
Given the multitude of uses, many organizations are turning to synthetic monitoring to enhance the user experience and optimize their networks. They use different synthetic monitoring tools to achieve their business goals.
The Best Synthetic Monitoring Tools
Let's dive deep into the key features of each of these tools to help you decide on the right fit for your organization.
1. ManageEngine Applications Manager – FREE TRIAL
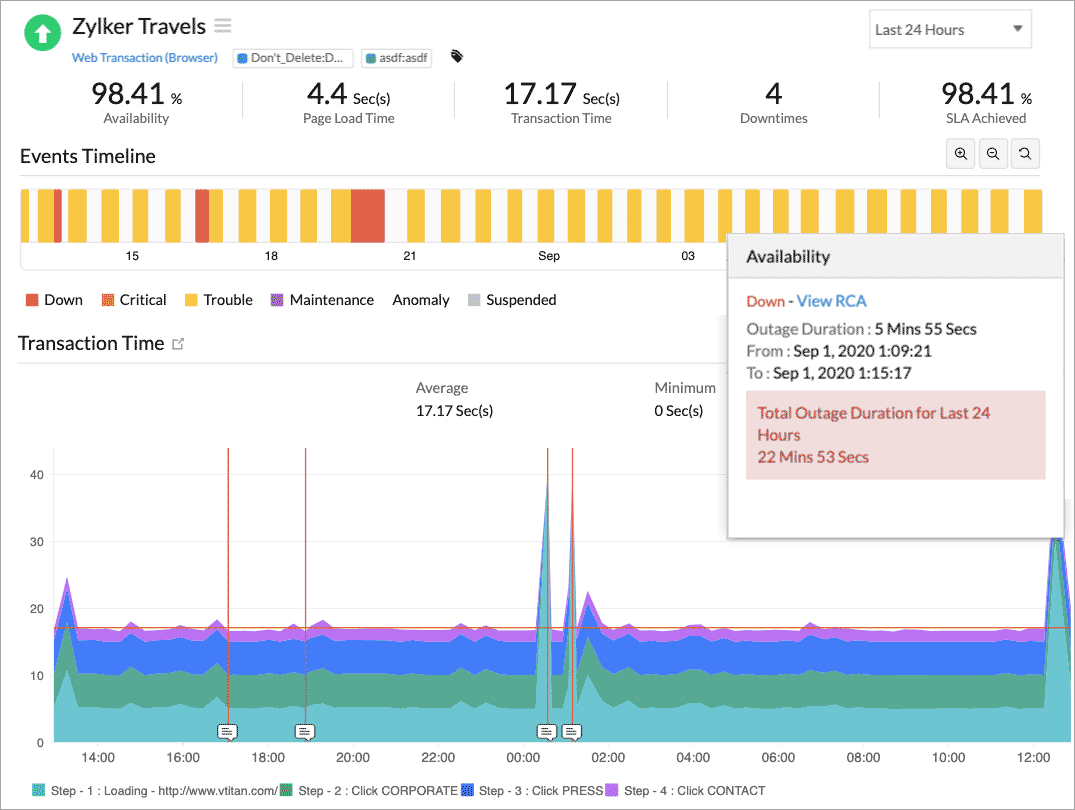
ManageEngine Applications Manager provides a range of tools for application monitoring, including a synthetic monitoring service for website performance tracking. As well as the standard availability monitoring, this system has a transaction testing service, which can be launched through real browsers from multiple locations. This system will run a script that you can set up by recording actions through a site. It will test interactive elements, such as menus and picklists. This service is useful for web design and marketing as well as for system monitoring.
The important services of the synthetic monitoring package in ManageEngine Applications Manager are laid out below.
Key Features:
- Multi-Step Transaction Simulation: ManageEngine Applications Manager’s synthetic monitoring allows IT teams to simulate complex, multi-step user transactions, such as logins and checkouts. This helps ensure that critical workflows perform efficiently under various conditions, allowing organizations to detect bottlenecks and fix issues before they impact real users.
- Global Performance Monitoring: The synthetic monitoring service can simulate user interactions from various global locations, providing insight into how application performance varies across different regions. This feature helps identify latency, server delays, or network issues that might affect users in specific geographic areas, ensuring consistent performance worldwide.
- Customizable Alerts and Reports: Applications Manager’s synthetic monitoring service allows for customizable threshold-based alerts. IT teams receive real-time notifications when performance metrics like response times or availability deviate from predefined standards. Additionally, detailed reports provide insights into error rates, transaction success, and uptime, helping teams proactively address performance issues.
The Synthetic Monitoring unit is just one of the tools available in Applications Manager for monitoring websites and other Web applications. The package also provides application discovery, dependency mapping, log collection and analysis and service availability tracking for servers and cloud platforms.
Applications Manager is offered in three editions and all of them include the Synthetic Monitoring service. The plans for the package are:
- Free: Five monitors
- Professional: A single-site monitoring service. Starts at $395 per year.
- Enterprise: A multi-site monitoring service. Starts at $9,595 per year.
You can get Applications Manager on a 30-day free trial.
EDITOR'S CHOICE
ManageEngine Applications Manager is our top pick for a synthetic monitoring tool because it provides a range of methods to test application performance by simulating user interactions. This approach allows businesses to monitor application availability, response times, and transaction success rates by mimicking real-world user behavior. Synthetic monitoring is crucial for identifying potential issues before they affect actual users, ensuring optimal application performance, and minimizing downtime. The synthetic monitoring service can simulate multi-step transactions, such as logins, purchases, or form submissions, to test the end-to-end performance of critical workflows. This capability ensures that business-critical processes are functioning smoothly and efficiently. Synthetic tests can be run from different geographic locations, allowing businesses to track performance variations across regions and ensure consistent user experience globally. The tool also offers customizable threshold-based alerts, notifying administrators of performance degradation or failures during simulated tests. With detailed reports on availability, error rates, and response times, IT teams can catch and fix potential issues before they impact users. The ability to integrate synthetic monitoring data with other performance metrics in Applications Manager provides more methods for keeping websites in tune.
Download: Get a 30-day FREE Trial
Official Site: https://www.manageengine.com/products/applications_manager/download.html
OS: Windows Server, Linux, AWS, and Azure
2. Site24x7 Synthetic Monitoring – FREE TRIAL
Site24x7 synthetic monitoring is a comprehensive tool for continuously testing the availability and performance of all the critical components that power your end-user's experience while guaranteeing the reliability of your site. It also helps to identify patterns for troubleshooting and enhancing the site's performance.
Key Features:
- Reduces the Risk of Downtime: Site24x7 runs tests at specified intervals to check if the components are available. You can run it from more than 120 locations globally to check the performance of your website and APIs. This information can help you understand the changes in the user experience for your global audience. More importantly, it can help you identify issues and fix them right away, thereby reducing the risk of downtime.
- Improves Speed and Performance: Site24x7 measures many metrics to provide insights on the current speed and performance of your site, and the factors that impact them. Based on this information, you can identify ways to improve the performance of your website. The advantage of such detailed metrics is that you can optimize every resource and component to reach your business goal.
- Simulates Transactions: The browser extension of Site24x7 records critical business transactions from multiple locations. It even simulates different traffic speeds to help you understand the performance of your site. It records the user actions from real browsers, so you can rely on them to understand the user experience. Additionally, you can even run Selenium scripts for deeper insights.
Overall, Site24x7 is a comprehensive tool to understand how your websites and APIs are faring and, more importantly, what you can do to optimize them.
Site24x7 offers four pricing plans:
- Starter: $9/month. Supports 10 basic monitors and 1 synthetic web transaction.
- Pro: $35/month. Supports 40 basic monitors and 3 synthetic web transactions.
- Classic: $89/month. Supports 100 basic monitors and 5 synthetic web transactions.
- Enterprise: $225/month. Custom
You can register to gain access to a 30-day free trial.
3. Datadog Synthetic Monitoring

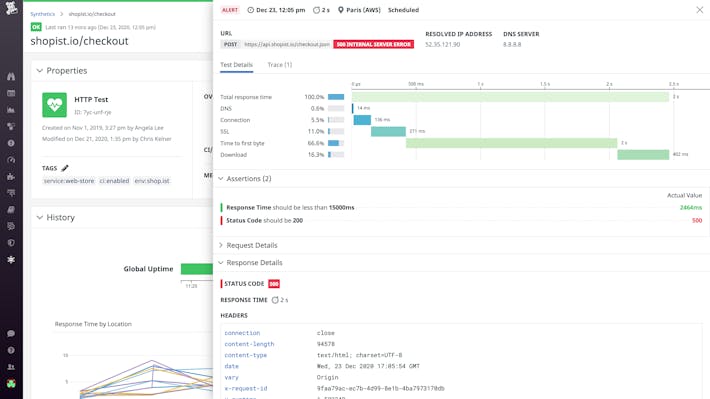
Datadog is a comprehensive tool that enables you to measure user experience and network performance across all stages of development. With this tool, you don't have to write extensive scripts to simulate transactions. Instead, you can use the intuitive UI to customize what you want to see.
Datadog comes with many convenient features for synthetic monitoring, and some of the key ones are as follows.
Key Features:
- Supports Proactive Monitoring: You can use API tests to validate all the layers of your infrastructure, including SSL, HTTP, DNS, and more. More importantly, you can run these tests from anywhere in the world. Once you run the tests, the metrics gathered from them are displayed on the dashboard. You even have the option to chain multiple API tests in a single session.
- Monitors Key Workflows: With Datadog, you can monitor every step of the workflow with screenshots to know how your application responds to user requests and transactions. Armed with such extensive information and visuals, you can easily modify configurations or build sub-tests to create the UX you want.
- Integrates with CI/CD Pipeline: You can integrate synthetic monitoring with your CI/CD pipeline to quickly detect and remediate issues. With such an integration, you can even use regression testing to evaluate your platform after every change and automate rollbacks when needed.
Overall, Datadog is highly sophisticated and offers the most convenient API and browser tests to evaluate just the metrics you want.

The API tests start at $5 per 10,000 test runs per month, while the browser tests cost $12 per thousand test runs per month when billed annually. If you choose to go monthly or on demand, the price increases to $7.20 and $18, respectively. Start a free trial of Datadog's synthetic monitoring.
4. SolarWinds Web Performance Monitor

Web Performance Monitor is a robust SaaS monitoring tool designed to evaluate the performance of your websites against established network performance and user experience metrics. It can also find internal and external performance issues, so you can fix them as soon as possible.
Below are some prominent features that can improve the overall performance of your websites and applications.
Key Features:
- Complete Performance Monitoring Solution: This tool monitors SaaS and web applications and, in particular, evaluates the user experience on your platforms. More importantly, it presents all the pertinent information on an intuitive dashboard to help you get a quick idea of what's going on in your applications.
- Comprehensive User Experience Monitoring: Another important aspect of the Web Performance Monitor is that it takes screenshots while running the simulation tests. This way, you know what a user sees and experiences at every step. Accordingly, you can make changes to enhance the user experience. You can even run these tests once every five minutes, especially when you want to record critical events.
- Out-of-the-box Reporting Capabilities: Web Performance Monitor generates custom reports for further analysis. You can generate reports for page load speeds, transaction health, uptime statistics, and more. Furthermore, these reports can be easily shared with relevant stakeholders for informed decision-making.

All these features make SolarWinds Web Performance Monitor a must-have tool when you want to know what users experience while using your applications.
Pricing starts at $1,275. Contact the sales team for a custom quote. Try a fully functional Web Performance Monitor on a 30-day free trial. Alternatively, sign up for an interactive demo.
5. Pingdom Synthetic Monitoring

Pingdom synthetic monitoring from SolarWinds is an all-in-one tool for evaluating the user experience on your website. In particular, it helps you quickly identify broken, slow, and unavailable links on your website so you can fix them for a better user experience.
Here's a look at how Pingdom can help you create meaningful websites that add value to users while enhancing your reputation and profitability.
Key Features:
- Easy to Set Up: A salient aspect of Pingdom is its ease of setup and use. There are no complex downloads or installations involved. Simply sign up for the tool and configure the ideal page speed, uptime, and transaction checks. Pingdom will start evaluating your website's performance against these baseline values and will notify you in the event of significant deviations.
- Creates a Seamless User Experience: Pingdom continuously monitors your website for any broken or unavailable links and notifies you right away. By addressing these issues, you can ensure a seamless user experience. With this tool, your users will no longer see the dreaded 404 Page Not Found error!
- Leverage the Insights: Another advantage of Pingdom is that it's easy to leverage the insights it identifies. In other words, you can export the metrics through APIs to other tools and platforms for further analysis. This feature makes it easy for you to integrate Pingdom with any existing platform or system.

Overall, Pingdom ensures that your users have the best possible user experience on your website while providing the insights you need to ensure high performance and consistency.
Pricing starts at $10/month. You can calculate your exact price. Try Pingdom for free and sign up for its interactive demo.
6. Sematext Synthetics

Sematext Synthetics is a 24×7 monitoring tool that helps you stay on top of user journeys on your websites and API services. This tool goes beyond just availability and performance, as it also includes monitoring SSL expiration, metrics of individual resources,

Sematext offers many interesting features, and some of them are described below.
Key Features:
- Identifies Performance Issues Quickly with Monitors: A key feature of Sematext is the insight it provides into the performance of your applications and their underlying resources. The best part is that you don't have to install any agents for this monitoring. Sematext automatically installs monitors that will run at scheduled intervals from specified locations. These monitors will collect the relevant metrics and alert you when the metrics deviate from the established thresholds. You can even customize these monitors using scripts.
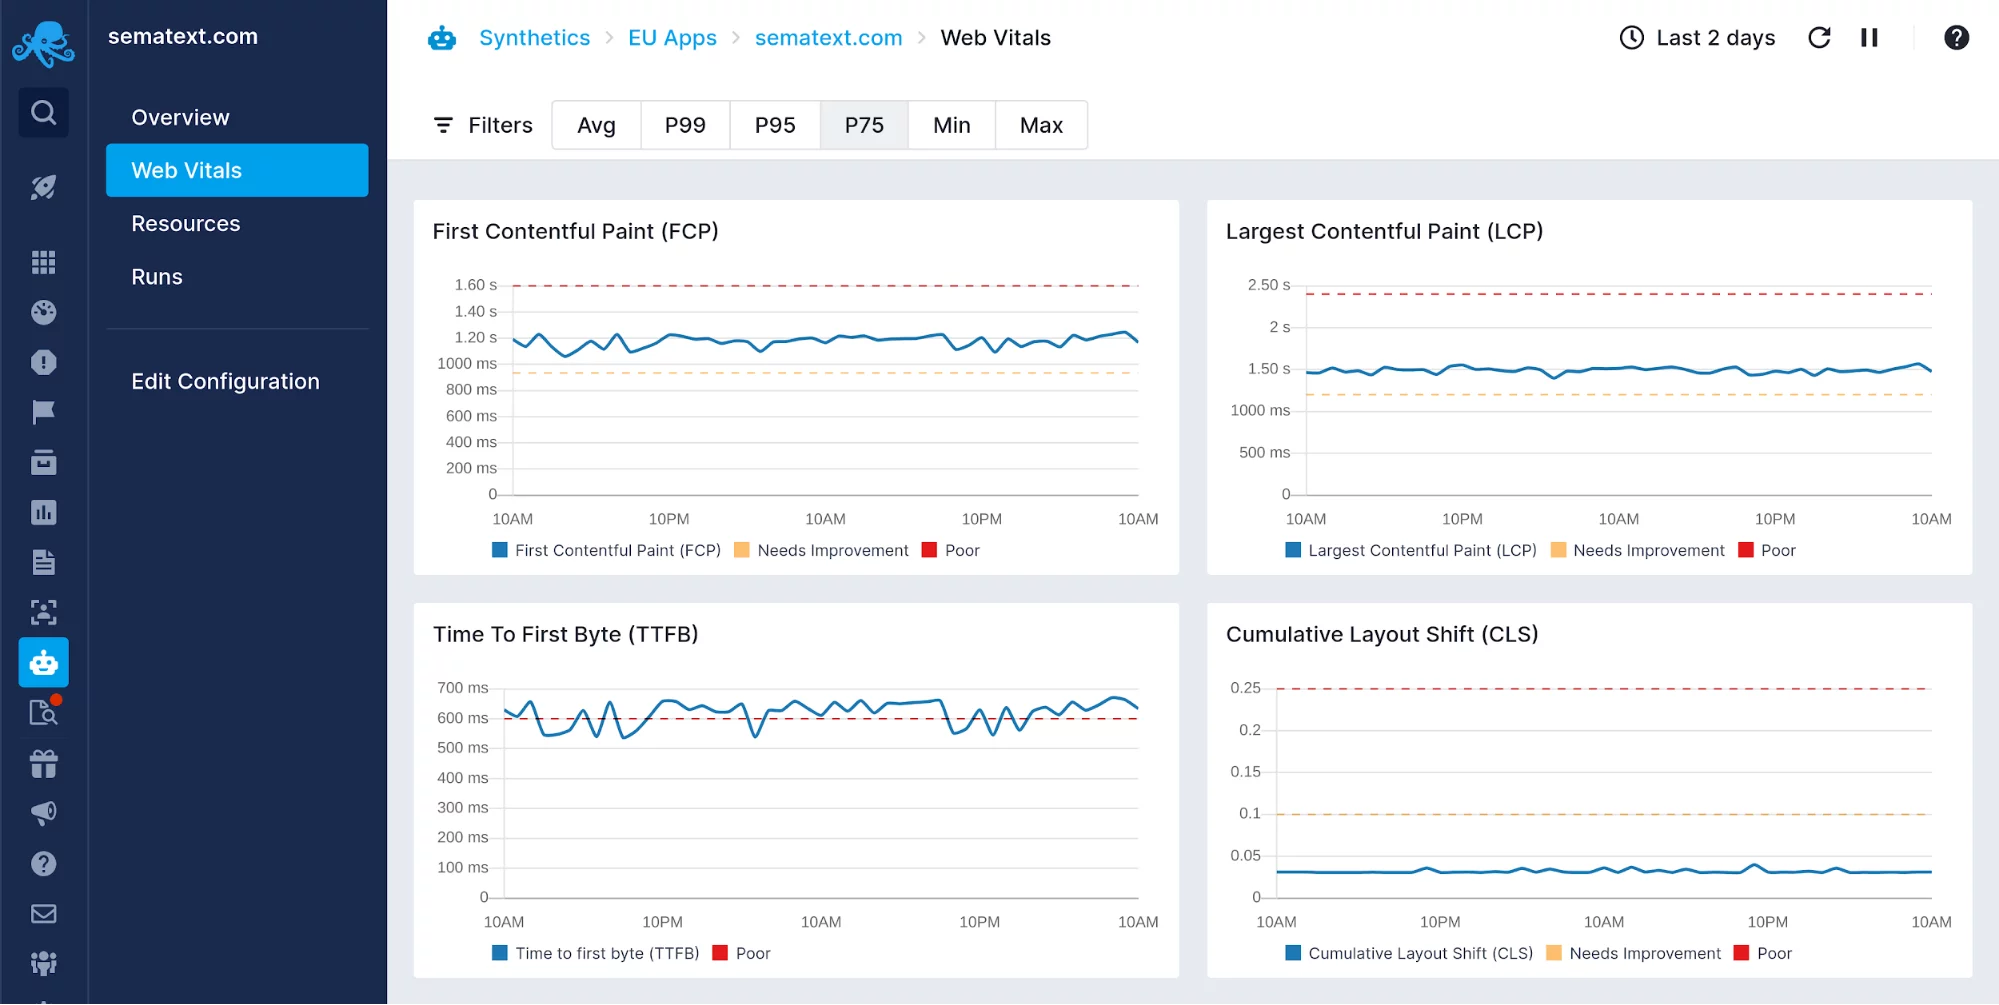
- Real-time Visibility: Like most tools available today, Sematext also provides real-time visibility into your websites and APIs. In particular, it monitors key metrics like DNS lookup times, socket connection times, response times, and more. Armed with these metrics, you can identify patterns and variations and use this information to improve the performance of your resources.
- Tracks Browser Errors: Typically, browsers log errors related to JavaScript functions, network errors, and more. These are valuable pieces of information that are not often leveraged. The good news with Sematext is that it collects these metrics and analyzes them to offer better insights. You can even use them to debug failures and issues.
In all, Sematext Synthetics is a handy tool for knowing more about the performance of your websites, so you can make the necessary changes to improve the user experience.
Synthetics start at $2 per monitor. Start a free trial to evaluate this platform's fit for your needs. You can also see a live demo.
Thus, these are some popular synthetic monitoring tools that you can use to gain a better understanding of the current state of your websites and how you can improve their performance.
Final Thoughts
Synthetic monitoring is a crucial software testing technique that proactively identifies and resolves issues before they affect real users. In this article, we discussed the concept of synthetic monitoring and the five best synthetic monitoring tools, including Datadog Synthetic Monitoring, SolarWinds Web Performance Monitor, Pingdom Synthetic Monitoring, Sematext Synthetics, and Site24X7 Synthetic Monitoring. We looked into the key features of each tool to help you make an informed decision about which tool is right for your organization.
We hope this information comes in handy for you to improve the performance and availability of your website and APIs.
Browse www.ittsystems.com for such extensive guides and lists.


