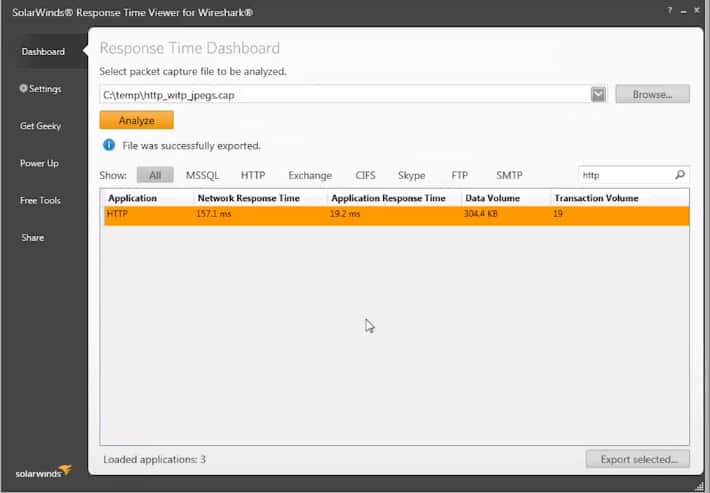
Wireshark is an industry standard in the field of networking and troubleshooting, and its use is normally the first point at which network engineers start their journey when embarking on a troubleshooting mission, including analyzing Packet Loss and Network Latency.
Wireshark works incredibly well, and it is able to dump huge amounts of data into its capture files (.cap extension), giving your support team more than enough data to chew on as they conduct their investigations and fault finding.
Sometimes we don’t need to look at every single send and receive bit from a data transmission, and instead we need to zero in on specific protocols or other metrics without having to manually sift through all of this data.
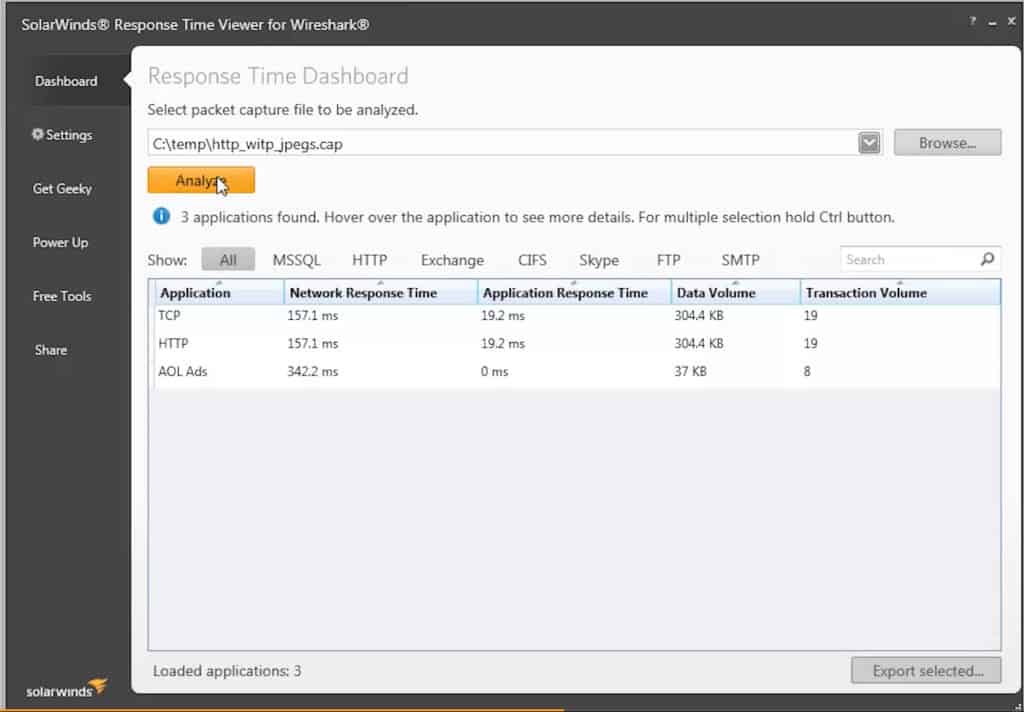
Response Time Viewer for Wireshark is able to simplify much of the filtering process by applying a set of template searches against the pcap files that are generated by Wireshark.
This makes the process of looking through captured data files that much easier, as you do not need to understand what packets belong to which service, it is all done for you.
There are over 1200 filters that come standard with the application, which means that all you need to do is feed your capture file into SolarWinds Response Time Viewer for Wireshark and let it start parsing all of the data for you.
There is also a built in search function that makes in-depth analysis and searching for exact application types much easier, which can save hours of trawling through pcap dumps with a fine tooth comb.
The file can then be exported back into Wireshark so that it can be further analyzed if necessary, or compared to other data samples that you might have gathered during the course of your investigation.
It is an especially handy tool when you are trying to analyze and pinpoint the cause of performance issues and strange network behavior such as increased traffic or network faults.
The tool is completely free to download and use, and can be found here:
https://www.solarwinds.com/free-tools/response-time-viewer-for-wireshark/registration
Response Time Viewer for Wireshark FAQs
What are some best practices for using Wireshark to analyze response times?
Some best practices for using Wireshark to analyze response times include using display filters to focus on specific network traffic, sorting packets by timestamp to view the timing of each packet, and correlating response times with other metrics like server load and application performance. It's also important to ensure that the captured traffic does not violate any privacy or security policies.
What types of response time measurements can be obtained in Wireshark?
Wireshark can be used to obtain a variety of response time measurements, including round-trip time (RTT), server processing time, network transfer time, and application processing time.
How do I calculate response times in Wireshark?
Response times in Wireshark can be calculated by subtracting the timestamp of the request packet from the timestamp of the corresponding response packet. Wireshark can also automatically calculate some response time metrics, such as RTT.
What are some common causes of slow response times?
Slow response times can be caused by a variety of factors, including network congestion, high latency, packet loss, and server or application performance issues.
How do I filter packets in Wireshark to analyze response times?
To filter packets in Wireshark to analyze response times, use the Response Time Viewer for Wireshark. Or, you can use the "tcp.analysis" filter to display only packets related to TCP communication, and then sort the packets by timestamp to view the timing of each packet.


