This article will be comparing the two SNMP monitoring applications: PRTG Network Monitor vs Zabbix.
The current version of Zabbix at the time this was written at is 4.2, and PRTG’s version is 19.2.50.2842.
PRTG, developed by Paessler, is a powerful and easy to use network monitoring tool capable of a wide variety of functions from network mapping to help-desk ticketing.
It is fully scalable and can be used by small businesses as well as multi-site corporations with ease. Running as an application on Windows, it provides an easy/quick install and a thorough tutorial on first launch.
 Zabbix is also a network monitoring tool, with support for network mapping scanning.
Zabbix is also scalable, and has support for cross-site diagrams. The Zabbix server does not run on Windows, and will require either a dedicated VM / Server with a live CD, or a version of Linux, Mac OsX, the BSD OS group, or Solaris.
Zabbix is not easy to install, and has a much steeper learning curve than that of PRTG.
Here's a Comparison of PRTG vs Zabbix:
- Automatic Network Scanning: Zabbix and PRTG both support this. PRTG does not require a client “agent” program installed on remote machines for data collection, whereas most features are only available on Zabbix if the agent is installed. Zabbix has some agentless collection methods, but they have a much lower variety.
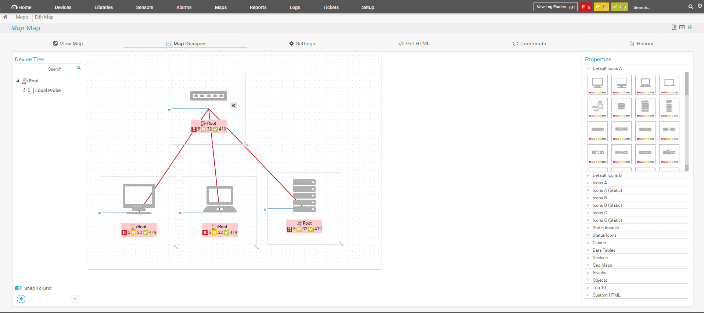
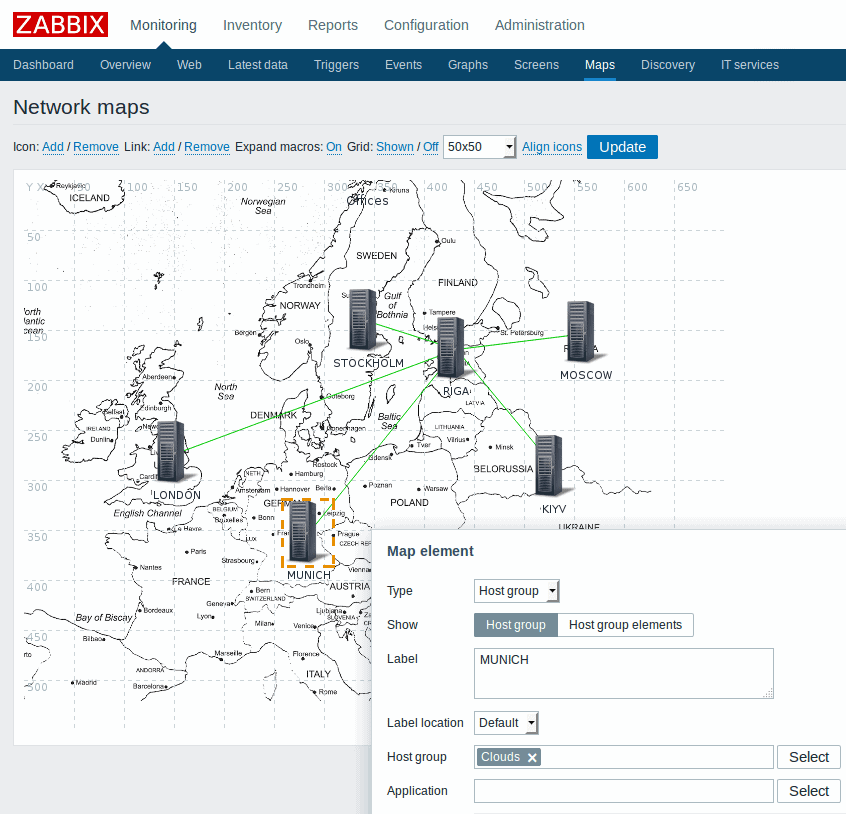
- Mapping / Topology: Both Zabbix / PRTG support custom mapping and network diagrams. Neither have auto-generated diagrams, and claim that network maps are best created manually due to the spacing and cluttering of many devices.
- Monitoring via SNMP, WMI, ICMP, etc: PRTG supports all of these. In addition, PRTG also supports SSH, packet sniffing, powershell, push message receivers, PRTG cloud monitoring, and others. Zabbix supports SNMP, WMI monitoring, and ICMP if you use the agent program on the remote machine. Agentless protocols include ICMP, TCP, SSH and Telnet.
- Database Monitoring: PRTG supports SQL, MySQL, PostgreSQL, REST, and more. Zabbix supports SQL, MySQL, PostgreSQL, and Oracle.
- QoS / SLA: PRTG is capable of monitoring QoS for VoIP, Cisco CBQoS, and more. Zabbix does not. PRTG also has a full help-desk ticketing program which can generate and assign tickets.Zabbix has the ability to measure SLA percentages being met by use of thresholds if you assign devices as children to other devices and set terms. It does not, however, have a ticketing system like PRTG, and is a more manual approach. Both products provide reports on their respective features.
- Computer/Server Hardware Health: PRTG offers monitors for hard drive health, printers, blade servers, virtual arrays, cisco devices, temperature and voltage, and more. Zabbix also provides a range of data collectors such as temperature, fan speed, voltages, disk states, and more.
- Internal Resource Monitoring: PRTG is capable of keeping track of CPU usage, memory usage, disk usage, network cards, Monitor bandwidth/traffic, speed/performance, availability/uptime, service information, and event logs. Zabbix has a different approach, but offers similar features such as CPU usage, memory usage, packets transferred, packet errors and collisions, disk space, the status of services, file sizes, windows logs and more.
- Web Server Monitoring: PRTG supports IIS and Apache, and is capable of scanning on http, https, ftp, and more. It is not capable of monitoring NGINX. In comparison, I could not find that Zabbix was able to monitor IIS, Apache, or NGINX in it’s documentation anywhere. Zabbix is, however, capable of collecting data for websites through use of http, https, ftp, and other protocols using agentless connections.
- Active Directory Monitoring: LDAP services and AD replication errors are supported by PRTG, which is actually quite useful. The program also integrates using LDAP if you wish, to better handle logons than custom accounts. In contrast, Zabbix did not support LDAP / AD authentication as far as I could find. It is capable of using LDAP authentication for connecting to devices and for logins, but directly monitoring the AD would most likely require custom scripting. Click to compare the best active directory monitoring tools.
- Netflow, IPFIX, sFlow, jFlow Monitoring: PRTG supports all of these, including both version 5 and 9 of Netflow.Zabbix appears to not support any of these protocols natively.
- VM HyperVisor Monitoring: PRTG supports VMWare, Hyper-V, and Citrix XenServer.Zabbix is capable of monitoring VMWare, vCenter, and vSphere, but it is not capable of monitoring Hyper-V.
- Application Monitoring Features: PRTG has a number of built-in monitoring types for applications such as Dropbox and others, and also has the ability to run scripts / .exe files and monitor windows services.Zabbix does not have native support for application monitoring except for through use of collecting info about running services. For both products, there is a quick and easy method to create a custom script that monitors specific applications manually and returns data to the server.
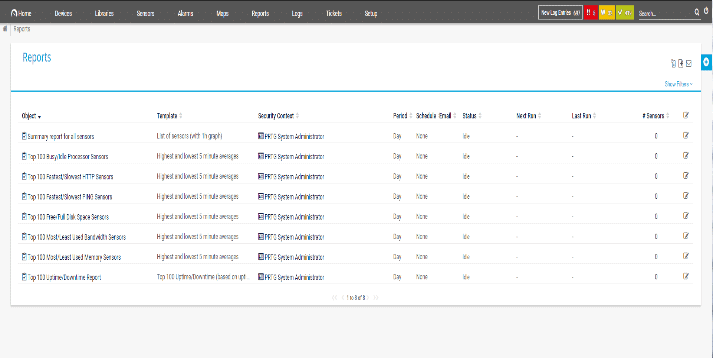
- Reports and Graphs of Historic Trends: For PRTG, there are a number of custom graphs and reports that come prepackaged with the product. There is also a massive yet simple report building tool that can aggregate just about any data you could need in a more organized and relevant manner.Zabbix has the same features, and the only difference that stands out between the two is the visual appeal that the PRTG reports have that Zabbix can’t quite compete with.
- Mobile App Support: PRTG is browser based, so apps are not necessary. That being said, there is an app for PRTG on both Android and IOS if you desire, and they are both given high reviews. By contrast, Zabbix does not offer an app for either platform.
Screenshots and Pros & Cons
Paessler PRTG – FREE TRIAL
Pros:
- Uses a combination of packet sniffing, WMI, and SNMP to report network performance data
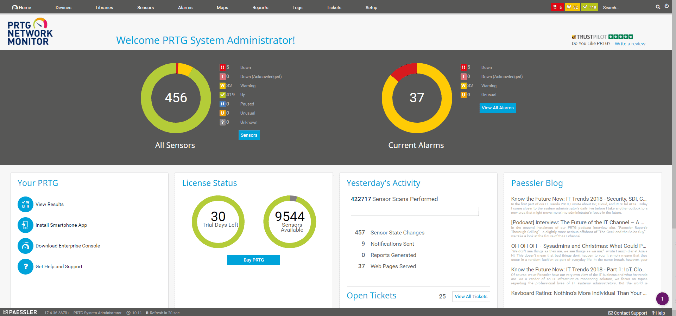
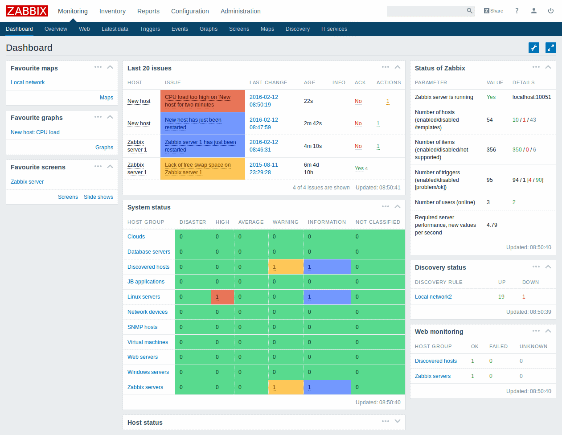
- Fully customizable dashboard is great for both lone administrators as well as NOC teams
- Drag and drop editor makes it easy to build custom views and reports
- Supports a wide range of alert mediums such as SMS, email, and third-party integrations into platforms like Slack
- Each sensor is specifically designed to monitor each application, for example, there are prebuilt sensors whose specific purpose is to capture and monitor VoIP activity
- Supports a freeware version
Cons:
- Is a very comprehensive platform with many features and moving parts that require time to learn
Zabbix
Pros:
- Open-source transparent tool
- Uses both SNMP and ICMP for a broader monitoring range
- Can detect new devices and configuration changes immediately
- Offers useful templates for quick insights
- Robust notification system supports SMS, email, custom script, and webhook
Cons:
- The interface isn’t as intuitive as solutions such as DataDog or Site24x7
- Would like to see better-alerting features, specifically related to reducing false positives
Conclusion
In summary, PRTG has a considerably higher amount of supported protocols and monitorable features than Zabbix. The design and UI are cleaner and feels more modern, and is simply easier to use. The installation and upgrading process for PRTG is also extremely fast compared to any of the Zabbix installation approaches.
Another fact to keep in mind is that PRTG does not require agents, and will require a lot less time installing an agent program on each remote device than would be expended with a Zabbix environment.
Another plus for PRTG is that you can upgrade to a higher tier license by paying just the difference between the current license and the higher license. PRTG also offers free support with one business day response times Monday through Friday, while Zabbix charges for support contracts and limits the amount of incidents you can call in for unless you buy one of the higher tier options.
Our Recommendation:
If the server OS is not an issue, PRTG is absolutely the Better Option, and I highly recommend you Download the 30- day Free Trial Version and see for yourself how intuitive and expandable the product is.
Official Site for PRTG: Paessler.com
Download PRTG Trial for up to 100 Sensors FREE Here!
PRTG and Zabbix FAQs
What can be monitored with PRTG?
PRTG is an IT system monitoring tool. It is composed of a series of individual sensors and the user can choose which of these monitors to activate. The package includes tools for monitoring networks, servers, and applications. This competence extended to wireless networks, virtualizations, Web assets, and systems such as Active Directory, MS Exchange Server, and databases. Network monitoring combines device health monitoring and also bandwidth analysis with services, such as NetFlow, sflow, and IPFIX. The PRTG system combines different monitoring services to create autodiscovery and network topology mapping. The system is able to test and trace the performance of services through a stack of components from user-facing applications, through networks, and servers.
What is Zabbix used for?
Zabbix is a free monitoring system that is able to track the performance of IT systems. These systems a categorized as networks, servers, and applications. Within these broad divisions, this system is able to monitor the health of network devices through SNMP. It also watches over device availability across the internet, which can be used to measure response times of Web assets. The tool has the capability to monitor virtualizations and other virtual services, such as cloud platforms. It can monitor wireless systems and communication encryption systems. The service and application monitoring tools in the package include Web servers, databases, email systems, and access rights managers.
Who owns Zabbix?
Zabbix is owned by Zabbix LLC, which is based in Riga, Latvia. The company was founded in 2005 by Alexei Vladishev, who also lead the development of the tool and is still the business’s CEO. The business also has offices in Japan, the USA, Russia, and Brazil. Businesses that use the tool include Dell, Zoom, Intel, Telecom Italia, T Systems China, ICANN, and Salesforce. In 2021, the company has a revenue of $23 million and has 78 employees.

