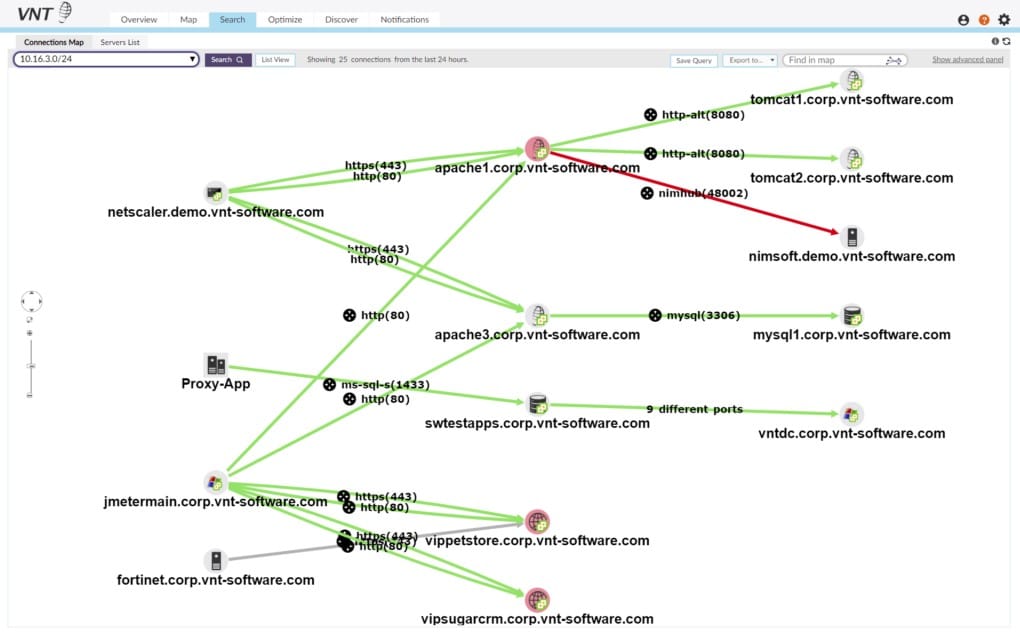
A network map is a visual map of a network’s physical and virtual connectivity, detailing devices on the network and their inter-relationships, and acts as a schematic guide, playing a vital role in keeping track of network activity as networks grow both in size and complexity over time and across organizations.
Network mapping assists in the breaking down of larger networks into smaller, digestible portions, allowing network administrators to view, track, and analyze overall network performance, and potential connection errors and identify root causes of issues faster, with more ease and precision.
The network maps are further customizable to suit the needs of network administrators and the detail of information they require.
Here is our list of the best network mapping and topology software:
- Paessler PRTG Network Monitor – EDITOR'S CHOICE A network, server, and application monitoring package that includes an autodiscovery feature. The tool compiles a live network device inventory and then offers a range of maps based on that data. Installs on Windows Server.
- ManageEngine Network Mapping with OpManager – FREE TRIAL A network monitoring utility that will automatically search the network and compile a list of connected devices. The system maintains live network topology layouts based on that data. Installs on Windows Server and Linux.
- Site24x7 – FREE TRIAL This cloud platform centers on its network monitoring tool that discovers, records, and maps all of the devices connected to the network, including switches, routers, firewalls, and endpoints.
- Auvik This network monitoring package is delivered from the cloud and it performs a network sweep that triggers the creation of a network inventory and a network map. The platform also provides constant network performance and security monitoring.
- SolarWinds Network Topology Mapper A system that automatically searches a network and discovers all of the equipment connected to it. The package offers a range of network topology map formats that it will then draw up from the device inventory. Installs on Windows Server.
- Fortra's Intermapper This network monitor will search through your network and list all connected devices. The interface then offers a range of layouts for live topology maps. Installs on Windows, macOS, and Linux.
- 10-Strike Network Diagram This tool specializes in drawing up network layouts and discovers the connected equipment on a network by itself. Runs on Windows.
- Progress WhatsUp Gold A network monitoring system that is based on the Simple Network Management Protocol and includes an autodiscovery system and a network mapper. Installs on Windows Server.
- Faddom This hybrid system discovery and mapping tool can be used to identify all network equipment and endpoints and produce a network topology map. Runs as a virtual appliance.
- NetBrain This is a network automation platform that includes a network scanner and a diagrammer that builds topology maps based on the scanner’s results. Runs on Windows.
- Opsview Monitor A cloud-based infrastructure monitor that can monitor any network anywhere, starting with a network discovery function and an automated topology mapper.
Auto-discovery tools used in network mapping further reduce the time needed to set up network maps and once created, perform network management tasks, as they automatically scan and map the network, discovering all devices connected to the network, indicating the different node relationships and component locations.
This data is then used for a range of purposes, including the drawing up an inventory, topology map detection, flow charts and network diagrams as well as the generation of reports.
With the near-constant evolution of networks, particularly in larger IT infrastructure, the roles of auto-discovery tools in automatic scans to update asset information, track changes and updates made to with the aim of ensuring data is available on hand, is fundamental to optimizing services and troubleshooting networks.
These tools allow network administrators to focus on finding solutions to problems arising within networks, saving both time and company resources.
Network mapping also forms an efficient security tool, as it can provide snapshots of live devices connected to wireless and wired networks in real time, speeding up the identification of suspicious connections or IP addresses on the network, with the further option of monitoring or disconnecting them.
Devices turned off can also be pinpointed, providing IP addresses are assigned to the devices, using SNMP, TCP, ICMP amongst others to discover hosts.
We have gathered the top tools for network topology with integrated auto-discovery for you, detailing their capabilities and strengths, with download links and pricing structures listed under each tool.
The Best Network Mapping & Topology Software
Our methodology for selecting network mapping tools and software
We reviewed various monitoring mapping tools and analyzed the options based on the following criteria:
- An autodiscovery system to log all network devices
- Support for a network topology mapper
- A facility to collect device status and network information in real-time
- Graphical interpretation of data, such as charts and graphs
- A free trial period, a demo, or a money-back guarantee for no-risk assessment
- A good price that reflects value for money when compared to the functions offered
Below you'll find our favorite tools and software that include Auto-Discovery features and other capabilities for creating Elaborate and detailed Network Maps and Topology of your network infrastructure.
1. Paessler PRTG Network Monitor – FREE TRIAL
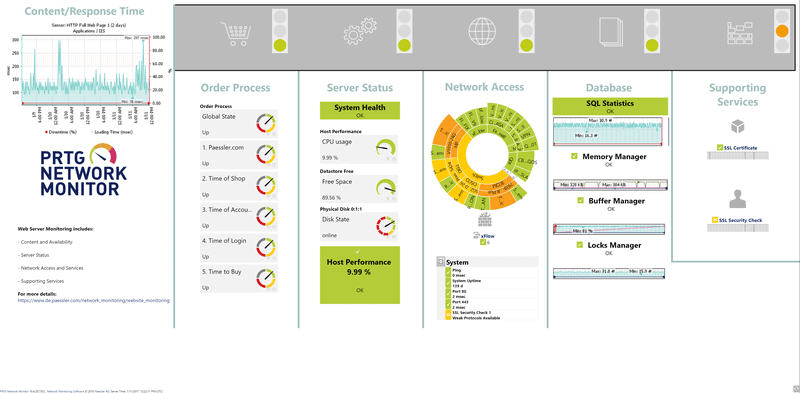
The Paessler PRTG Network Monitor is an IT infrastructure monitoring tool which automatically tracks the overall health and performance of networks, their devices, databases, traffic, hosts and more with the added benefit of monitoring equipment both on the premises and on the cloud, while also supporting hybrid environments.
Key Features:
- Auto-discovery for devices
- Customizable network maps
- 24/7 monitoring capabilities
- Variety of alert mediums
Why do we recommend it?
We recommend Paessler PRTG Network Monitor for its robust tracking of network health and performance, utilizing auto-discovery and a user-friendly dashboard that facilitates easy monitoring and mapping.
Additionally featuring cross-locational network discovery, it can include devices spread out over different locations in the monitoring and mapping of a network.
The Paessler PRTG Network Monitor uses monitoring sensors to track metrics from a single platform and the software will stick to its defaults if the sensors are not defined when running it for the first time.
Scanning and mapping of the network will then begin, with auto-discovery detecting and setting up all devices and their links on the network, which once discovered and documented, are monitored through these sensors.
Timetables can be set up to run discovery automatically at different intervals, such as daily, weekly, or monthly, with a ticket and email notifying you of the scan, but The Paessler PRTG Network Monitor will also monitor your network 24 hours a day, each day of the year, which aids in discovering devices which may not have been turned on during a standard one-time scan.
This allows for constant and accurate data on the state of your network, and if a problem is detected, fully customizable alerts will instantly notify you with the aim of avoiding serious disruptions to workflow, ensuring fast and effective corrective actions for issues arising within the network.
The auto-discovery feature of the Paessler PRTG Network Monitor also eases the process of taking stock of the network, automatically locating any new devices within an IP address range, adding them into your existing inventory to integrate them into your network map and monitoring.
A straightforward and easy-to-navigate dashboard shows the status of the network and all individual devices linked to the network, offering a quick overview of your infrastructure via your desktop or an app if you are out of the office, with free push notifications allowing you to stay up to date when access to your network is limited to a mobile device.
Clear, clean and visual network maps, using a simple drag and drop option in the built-in map editor, easily integrate all components monitored by the Paessler PRTG Network Monitor.
The use of custom HTML can also create multi-layer maps, while adding external images or applets to the network map is not an issue, allowing extensive customization to suit your needs.
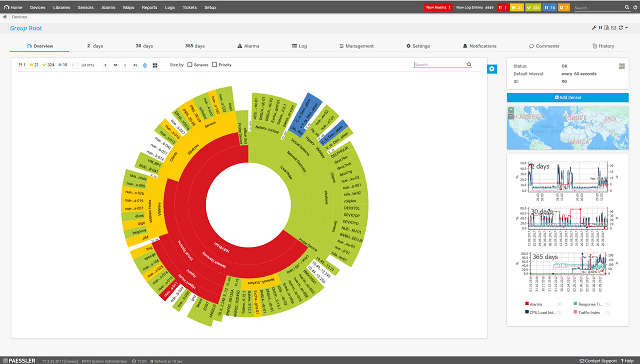
There are multiple formats of network maps offered, with its sunburst view showing circles of applications together along with the hardware and services supporting each one, while the standard map plots all the devices in the network in a simple fashion, with connections shown as straight lines.
Icons, which can be altered, are used to represent nodes and color coded statuses for devices and the links between devices are shown in green and red for easy identification of healthy and problem links, devices.
Other maps can be personalized to show a building plan with the live location of each device on the premises, integrating photos of the individual offices, or even plotting your network on a real map of the world, which is ideal for WANs.
Each map available is customizable through the use of a mapping module and their focus can be changed on command.
The fact database underpinning these mapping formats, assembled automatically when the PRTG Network Monitor is installed, is kept running and updated by the network auto-discovery function, ensuring changes made to your resources adjust your network maps to ensure accuracy in the monitoring of your network.
The Paessler PRTG Network Monitor on-premises is only available on Windows Servers but can also be used as a cloud-based service.
Who is it recommended for?
It’s recommended for IT professionals needing a versatile monitoring tool capable of handling both on-premises and cloud equipment, with a particular emphasis on continuous monitoring.
Pros:
- Uses a combination of packet sniffing, WMI, and SNMP to report network performance as well as discover new devices
- Autodiscovery reflects the latest inventory changes almost instantaneously
- Drag and drop editor makes it easy to build custom views and reports
- Supports a wide range of alert mediums such as SMS, email, and third-party integration
- Supports a freeware version
Cons:
- Is a very comprehensive platform with many features and moving parts that require time to learn
You can download a 30-day free trial. After 30 days, the trial version will revert back to a free version, which can monitor up to 100 sensors, while the option to upgrade to a paid license exists at any time.
EDITOR'S CHOICE
Paessler PRTG Network Monitor is our top pick for a network discovery and mapping tool because use it combines powerful discovery features with intuitive network mapping capabilities, making it ideal for organizations of all sizes. The tool automatically detects and maps devices, giving administrators a clear and comprehensive view of their network's structure and performance. This automated discovery reduces manual setup time and ensures that the network map is always up to date. PRTG provides an interactive map of the entire network topology, displaying real-time data on the status and health of each device. This level of visibility is essential for IT teams to monitor and troubleshoot network performance effectively. The maps are fully customizable, allowing users to tailor them to their specific needs, whether it’s for a small office network or a large, complex infrastructure. Another key feature of PRTG is its ability to group devices based on location or function, making it easier to manage different segments of the network. The mapping tool also integrates with other network monitoring features, allowing administrators to detect potential issues and address them proactively.
Download: Get a 30-day FREE Trial
Official Site: https://www.paessler.com/download/prtg-download?download=1
OS: Windows Server or SaaS
2. ManageEngine Network Mapping with OpManager – FREE TRIAL
ManageEngine is an infrastructure monitor that supervises networks and servers. On installation, the tool sweeps the network and discovers all connected devices. It then compiles a network inventory from the information it gleans. The network inventory is constantly updated, so any changes to the network’s equipment are instantly noted.
Key Features:
- Autodiscover and mapping
- Customizable widgets
- Intelligent alerting system
- Extensive integration options
Why do we recommend it?
ManageEngine OpManager stands out for its efficient auto-discovery feature and the ability to create detailed, customized network maps, making network management more intuitive and effective.
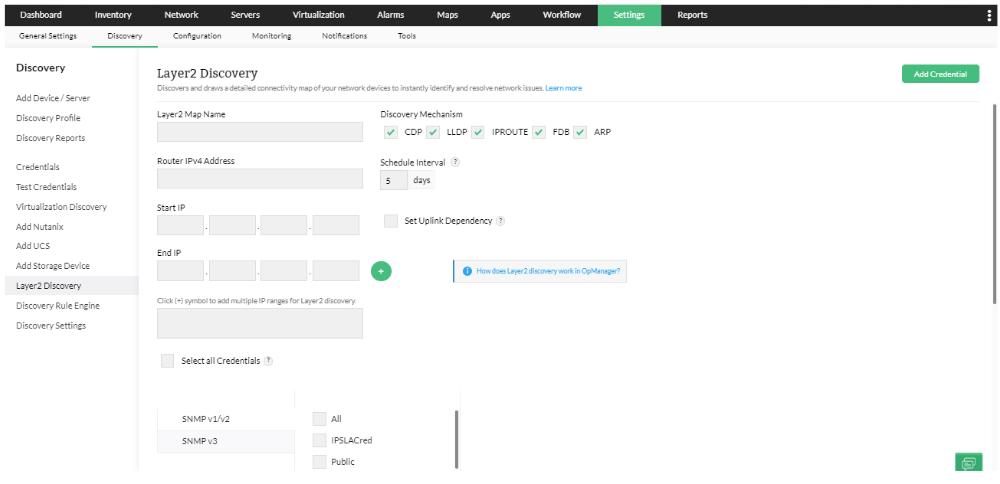
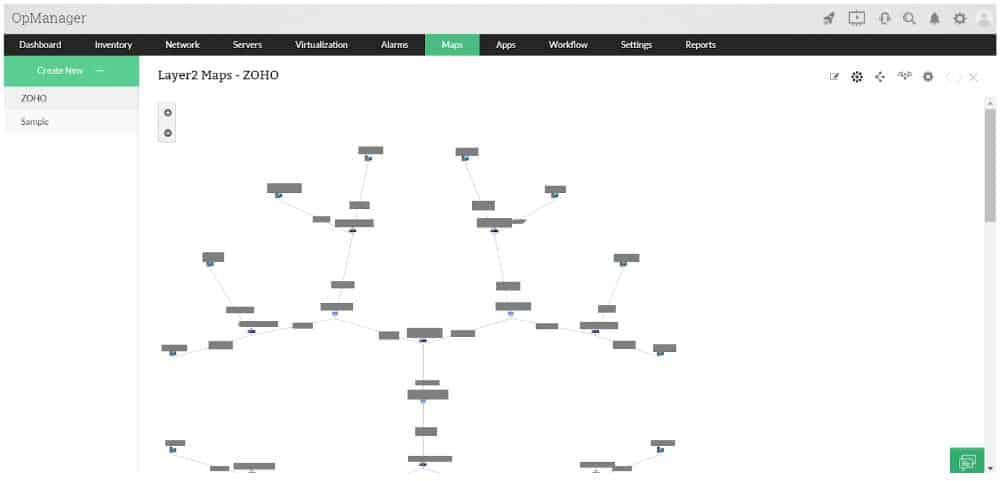
OpManager also includes a network topology mapping function. This service draws up network layouts instantly by interpreting all of the data stored in the network inventory. Thus, when the network inventory gets updated with equipment changes, the network layout also gets automatically redrawn.
The network topology mapper offers a range of layouts. These give views of different levels of equipment, for example, a Layer 32 map or a Layer 3 diagram, or a WAN view. Multiple site networks can be plotted on a real-world map.
OpManager is on-premises software that installs on Windows Server and Linux. It is able to monitor remote networks as well as the LAN on which it is resident.
Who is it recommended for?
This tool is best suited for network administrators seeking a feature-rich solution for comprehensive network monitoring and mapping, particularly in environments requiring integrations with other ManageEngine products.
Pros:
- Designed to work right away, features over 200 customizable widgets to build unique dashboards and reports
- Leverages autodiscover to find, inventory, and map new devices
- Uses intelligent alerting to reduce false positives and eliminate alert fatigue across larger networks
- Supports email, SMS, and webhook for numerous alerting channels
- Integrates well in the ManageEngine ecosystem with their other products
Cons:
- Is a feature-rich tool that will require a time investment to properly learn
There are three editions of OpManager: Standard Professional, and Enterprise. All of these versions include automatic discovery and topology mapping but the two higher plans include more map layout options.
ManageEngine offers a 30-day free trial of OpManager.
3. Site24x7 – FREE TRIAL
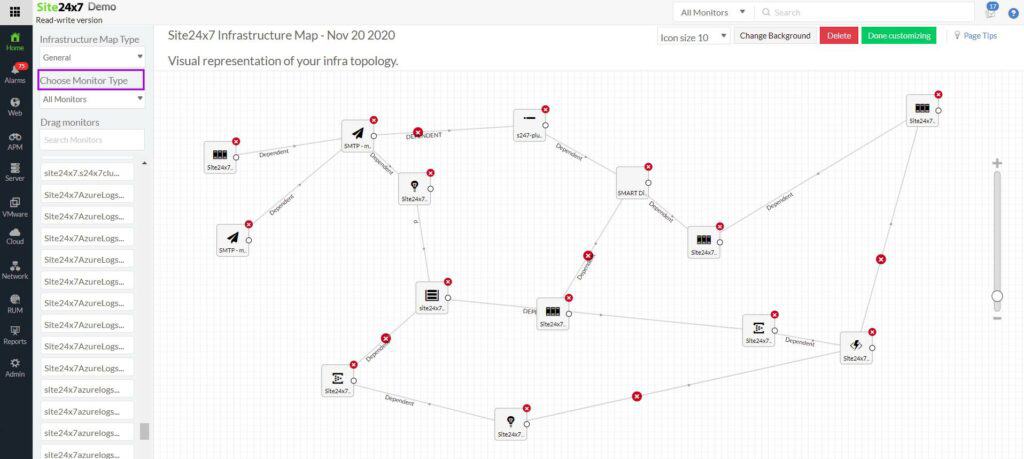
Site24x7’s Network Topology Mapper is an essential tool for businesses looking to visualize and manage their network infrastructure. This tool automatically discovers network devices and maps the entire network topology, including routers, switches, firewalls, and servers. With the topology map, administrators can easily identify device relationships, understand network dependencies, and pinpoint potential issues.
Key Features:
- Autodiscovery
- Automatically generated hardware inventory
- Constantly updated network map
- Network device health monitoring
Why do we recommend it?
Site24x7 generates a map from discovery data. However, its drag-and-drop interface allows users to customize the map, adding or removing elements as necessary, providing a dynamic view of the network’s architecture. This detailed visualization simplifies network management and helps in troubleshooting by providing a clear picture of how devices are connected.
The platform’s related modules, such as the network performance monitoring and device health modules, are interconnected with the topology map to provide deeper insights into network performance.
Site24x7’s network monitoring module provides real-time monitoring of device health and performance metrics, including CPU usage, memory utilization, and traffic load. This data is displayed alongside the network topology, allowing IT teams to quickly correlate performance issues with specific devices or network segments.
With continuous monitoring and real-time alerts, Site24x7 helps businesses proactively manage their network health and minimize downtime.
Site24x7’s topology mapping integrates with its configuration management module, enabling administrators to back up and restore device configurations directly from the topology map.
Device management is highly automated and that allows users to quickly access and apply configurations based on their topology, reducing the risk of configuration errors and enhancing overall network reliability.
By combining network topology mapping with powerful performance and configuration management tools, Site24x7 provides a comprehensive solution for network monitoring, maintenance, and optimization.
Who is it recommended for?
Site24x7's Network Topology Mapper is recommended for businesses of all sizes that need to manage and monitor complex network infrastructures. It is especially beneficial for organizations with large, distributed networks or those that rely on a wide range of network devices, such as routers, switches, and firewalls.
Pros:
- Users can customize the network topology map
- Includes a log manager
- Detailed information about the health and status of network devices
- Network configuration management
Cons:
- No on-premises hosting option
Site24x7 is a cloud-hosted SaaS system, so you sign up for the package on the service’s website. You can examine the package with a 30-day free trial.
4. Auvik
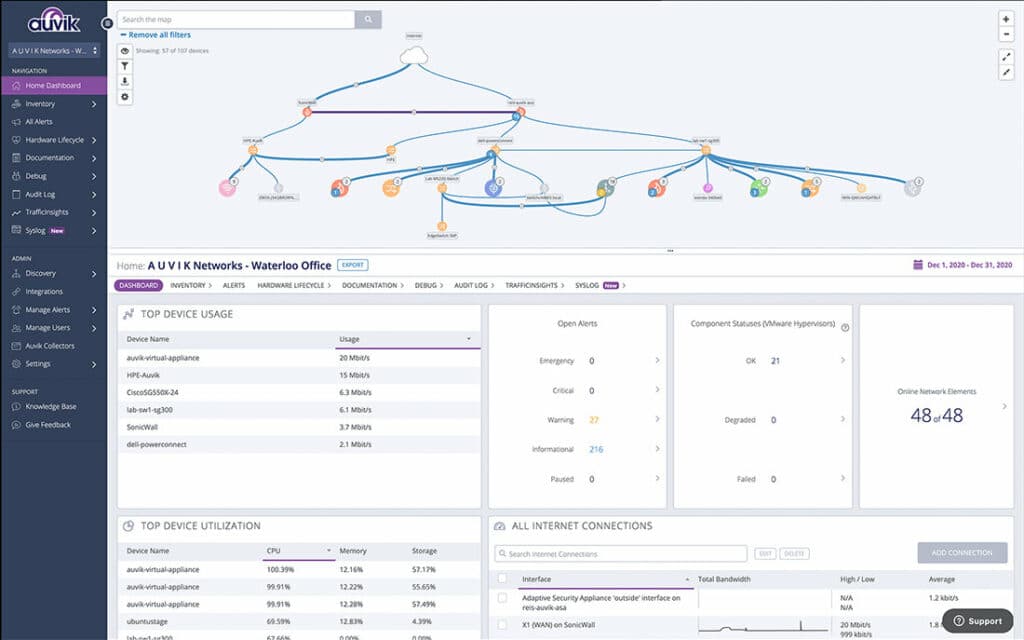
Auvik is a network monitoring and management package that is delivered from the cloud and enrolls a network by installing an agent program on one of the servers connected to it. The agent scans the network and uploads records of its findings to the Auvik cloud server. Auvik uses this data to create a hardware inventory and generate a network map.
Key Features:
- Cloud-Based Monitoring: Delivers network management and monitoring services entirely from the cloud.
- Automated Discovery: Utilizes agent-based scanning to automatically inventory and map network hardware.
- SNMP Integration: Employs SNMP for real-time device status updates and network health monitoring.
- Configuration Tracking: Continuously tracks and compares device configurations, alerting on changes.
- Traffic Analysis: Analyzes network traffic using protocols like NetFlow, IPFIX, sFlow, and J-Flow.
The Auvik system is based on a series of network scans. The discovery routine is the first of these and another is a polling process that is based on the Simple Network Management Protocol.
Why do we recommend it?
Auvik is an exceptional tool for its comprehensive cloud-based network monitoring capabilities. Its strengths lie in automated network discovery, continuous device monitoring, and proactive traffic analysis, making it indispensable for efficient network management and security.
This SNMP process broadcasts a request across the network. Every network device is shipped with an SNMP agent installed on it and that program listens for a request. Until a request arrives, the agent scans the device that hosts it and fills in a form of status reports. It sends that report back in response to a request.
The Auvik server creates a live status report in the system dashboard. A device agent will send out a warning without waiting for a request if it identifies a problem during its scan. This is represented as an alert in the Auvik dashboard.
One more scanning routine in the Auvik package copies the configuration of each device and stores it.
Every 60 minutes, the scanner returns to the device and compares its current configuration to the one on file. If the two are different, the system takes a new copy and stores that as a new version. It doesn’t overwrite the original configuration image.
The network discovery scan has a security element to it because it will reveal all devices connected to the network, including those that shouldn’t be there.
The network configuration manager is another security feature because device configurations include security settings, such as an activity logging requirement and access control lists (ACLs). Intruders need to manipulate these settings in order to move around a network undetected. By checking on changes, the Auvik system offers the opportunity to remove discovered changes by restoring a previously saved configuration image.
The Auvik network monitoring service also includes a traffic analyzer. This uses flow protocols to extract traffic data from switches and routers. By comparing current traffic levels to the total potential capacity of an interface, the monitor can identify whether traffic levels are rising too high for the device to cope. It will then raise an alert.
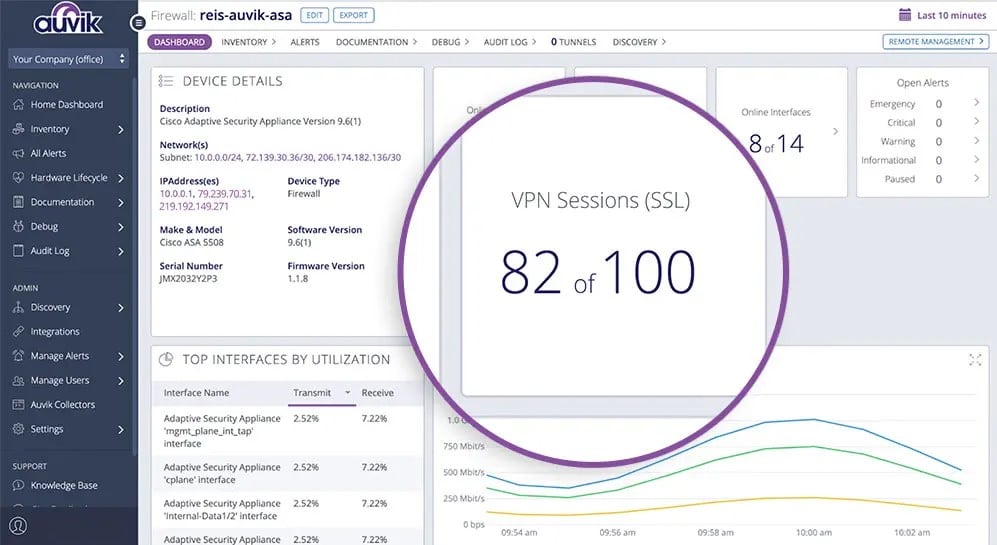
Traffic data can be sorted and segmented by a range of attributes, such as source, destination, and protocol. The traffic insights that this part of the Auvik system provides can be used to spot peaks and troughs in throughput and also identify the biggest traffic generators. Network managers can use this information to replan the network, add on capacity, or implement traffic shaping to prioritize particularly time-critical protocols.
Who is it recommended for?
This tool is ideal for network administrators and IT professionals who require a reliable, scalable solution for real-time network monitoring and management, especially in environments where cloud-based solutions are preferred for their ease of deployment and maintenance.
Pros:
- Network discovery, inventory creation, and mapping
- SNMP-based device status scanning
- Traffic statistics gathered with NetFlow, IPFIX, sFlow, and J-Flow
- Network configuration management
- Protocol analysis
Cons:
- No on-premises version
Sign up for a 14-day free trial.
5. SolarWinds Network Topology Mapper
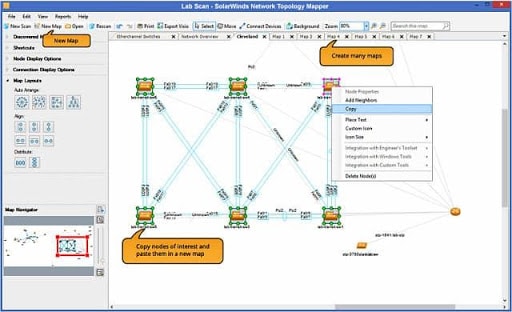
SolarWinds Network Topology Mapper is one of the more advanced mapping tools available and is specifically designed for the scanning and mapping of networks, its auto-discovery features allowing for the automatic detection and mapping of devices in a network and scaling of topology maps generated as changes occur to the IT infrastructure.
Key Features:
- Automatic device detection
- Interactive network maps
- Multi-level network discovery
- Powerful reporting tools
Why do we recommend it?
SolarWinds Network Topology Mapper is recommended for its advanced network scanning and mapping capabilities, particularly its automatic device detection and interactive mapping features that make network management efficient and user-friendly.
Used as an effective network guide for administrators, the SolarWinds Network Topology Mapper presents a clear and precise overview of all equipment linked to the network with its user friendly interface.
With the ability to discover devices on demand, the software uses the automatically collected information to build one or multiple interactive maps.
It can also build additional, accurate network maps without having to re-scan the network, with the option of compiling several perspectives from one scan.
The interactivity of the maps further allow network administrators to label groups of nodes with roles, such as vendor, location, machine type and other headings, for the easy identification and tracking of network traffic, and nodes, displayed as clickable icons, can be removed both individually and as groups.
Detailed information is available on each node’s status and inventory reports containing raw network data can be exported into CVS for review.
The diverse representation of devices through existing icons found in SolarWinds Network Topology Mapper’s library aids in visually displaying topology maps created, and these icons can be adapted to design specific icons for different individual or groups of nodes within the network maps.
These network maps can be filtered further by device type and network elements and multi-level network discovery can be performed in order to inspect network performance and traffic in detail.
With alterations to the existing network updating the system topology automatically and sending immediate alerts which relay the changes made through the use of auto-discovery, the automation of these tasks saves time and resources, making maintenance and troubleshooting easier.
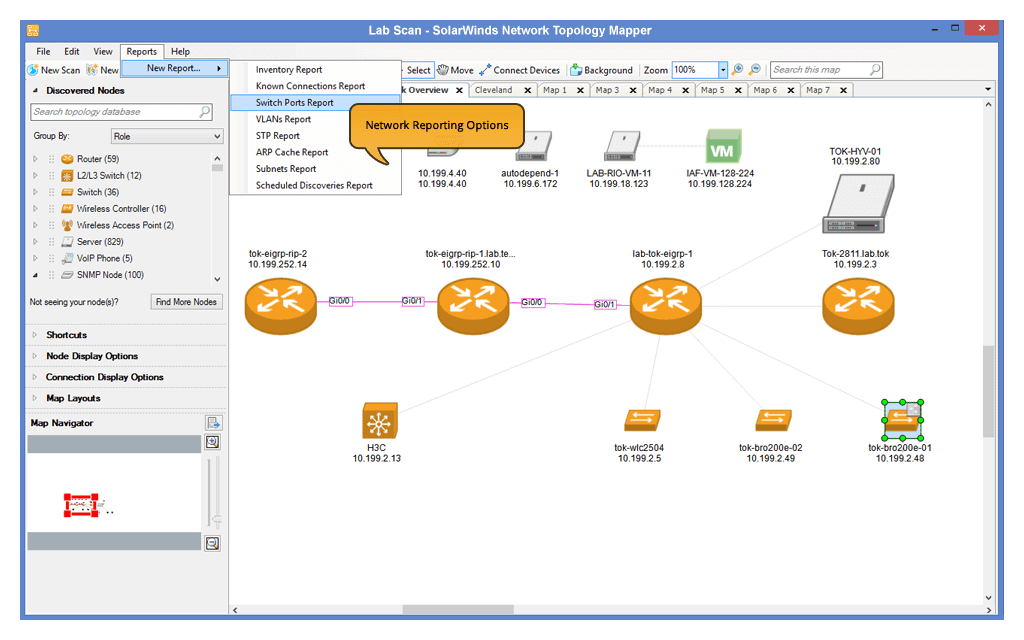
SolarWinds Network Topology Mapper’s powerful reporting tools help keep track of network information and inventory and can create extensive reports for the tracking of hardware inventory, switch port data, VLANs as well as subnets. For a more in-depth analysis, these reports can be exported into PDF and PNG files.
Who is it recommended for?
This tool is ideal for network administrators who require a comprehensive overview of their IT infrastructure, especially in complex networks needing detailed mapping and regular updates.
Pros:
- Uses autodiscover for automated mapping, great for larger more complex networks
- Uses multiple protocols to identify network devices, ICMP, SNMP, WMI, and CDP
- Designed to work in virtual environments and supports both VMWare and Hyper-V hosting
- Can build static maps and include devices from your network for capacity planning and testing
Cons:
- Would like to see a longer trial period
The SolarWinds Network Topology Mapper runs on Windows environments and is compliant with both PCI and FIPS-2 standards. You can download a 14-day free trial.
6. Fortra's Intermapper
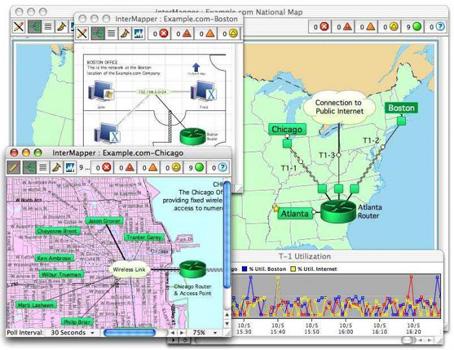
Intermapper, developed by Fortra, is an industrial strength network monitoring software designed to work hand in hand with auto-discovery, and its powerful ability to automatically detect, document and scale tens of thousands of devices within a network, by use of its low-bandwidth polling engine, and translate the information into detailed, dynamic network topology maps proves its capability.
Key Features:
- Dynamic network mapping
- Real-time network view
- High customization options
- Extensive alert configurations
Why do we recommend it?
Intermapper is recommended for its dynamic mapping capabilities and real-time network insights, offering high customization and effective alert settings, ideal for detailed network analysis.
It locates all IP assigned devices in your IT infrastructure in minutes, whether physical, virtual or hybrid, enabling real time view of your network through the creation of a visual based inventory of all network devices, while also allowing the conduction of real world testing of systems or polling the system to view the status of the network health and its performance.
Intermapper also performs scheduled network scans to discover, update and adjust topology maps whenever new devices are detected.
To further speed up the process of analyzing and troubleshooting networks, Intermapper provides one-click charting of network data, with the option of storing this data to assist with capacity planning, trend analysis and SLA compliance reporting, also allowing network administrators to filter specific parts of the network.
You can view the IT infrastructure of the company or organization by their location, either by your office or their floor, and the overall interface is created with the aim of simplicity and easy use, with network devices color coded for identification of issues within the network and quick-glance assurance of a smooth running network.
Intermapper offers high customization and visibility in its network topology maps, allowing the change of layouts, icons and images, with the ability to upload floor plans or layout pictures for use as a background for the network topology map.
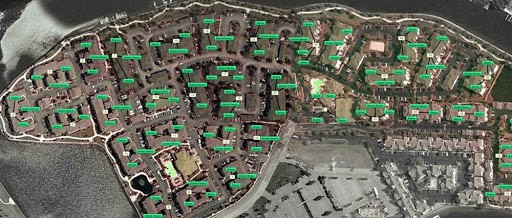
You can even integrate Google Earth with Intermapper, which provides the geo-location of all network devices linked to the network, helping in the identification of devices that are down with real-time alerts and their exact locations on a geographical space.
Intermapper’s notification system allows the configuration of alerts on certain devices and these alerts can be selected for a specific group of devices, be based on notification schedules created and certain thresholds.
While they are displayed in the central console, with configuration, alerts can be received via email or SMS in the case of potential problems picked up within the network and its devices.
Intermapper is compatible with Windows, Mac OSX and Linux.
Who is it recommended for?
It is ideal for network professionals who need a detailed and customizable view of their network, with a particular focus on real-time status and performance.
Pros:
- Offers a free and paid version
- Is capable of using auto-discovery to find new devices
- Features SLA compliance reporting, good for MSPs and larger networks
- Available on Window, Linux, and Mac, making it a flexible option across multiple operating systems
Cons:
- The interface feels outdated, making it difficult to navigate at times
- Visual options are limited
- Maps are generally not visually appealing, not great if used in a presentation
You can download a 30-day trial and the free version of Intermapper here.
7. 10-Strike Network Diagram
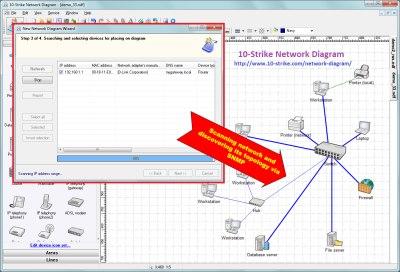
The 10-Strike Network Diagram features auto-discovery capabilities with its network topology discovery software, and specializes in the creation of network maps, scanning a wide range of IP addresses within minutes by using multiple parallel threads to search for network devices located in a specified range, such as switches, database servers, network printers and routers among other devices, recognizing these devices through its original, sophisticated algorithm.
Key Features:
- Sophisticated auto-discovery
- Versatile graphics editor
- Google Maps integration
- Comprehensive mapping features
Why do we recommend it?
10-Strike Network Diagram is recommended for its effective auto-discovery and versatile graphics editing tools, making it a great choice for creating detailed and customized network diagrams.
The graphics editor provided by the 10-Strike Network Diagram is one of the tool’s main utilities, and its library carries several IT related icons which can be dragged and dropped onto the software’s design pad, customizing the network map automated through the scanning of the network and identification of all devices linked to it for easier viewing.
Links are also drawn between devices discovered (providing switches in the network support the SNMP protocol) with port names used to label switches and all information gathered is used to automatically draw up a graphical network graph, LAN diagrams for documents as well as discovering, mapping and documenting network topology, which can be exported to Microsoft Visio for further editing.
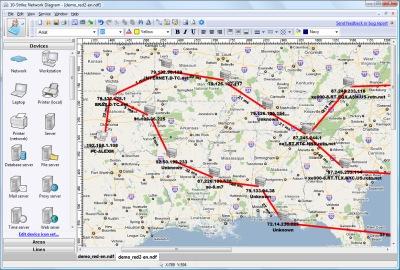
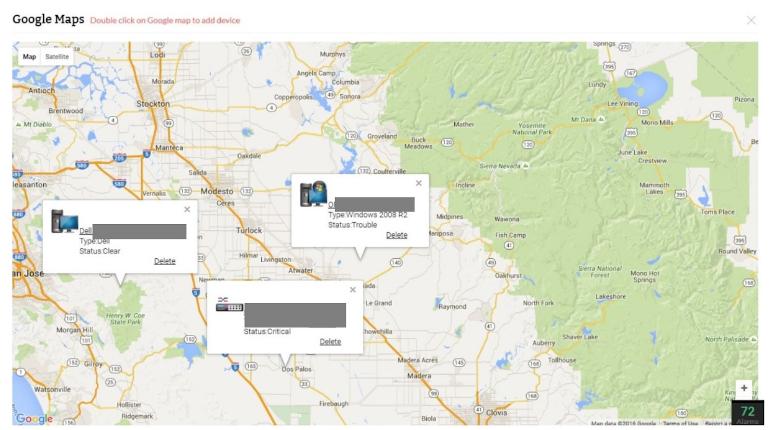
The 10-Strike Network Diagram’s auto-discovery includes the provision of a real world map, based on Google maps, plotting locations of each router it passes through on the map for convenient tracking of connections across the internet for faster tracing and monitoring of all traffic passing through the network.
This in turn speeds up the process of locating suspicious connections or IP addresses on the network. The 10-Strike Network Diagram is available on Windows environments.
Who is it recommended for?
This tool is suitable for IT professionals who need a reliable and flexible solution for creating detailed network diagrams, especially those requiring integration with external mapping services like Google Maps.
Pros:
- Supports both auto discovery as well as static diagram mapping
- Has a variety of network icons as well as other icons, giving it dual functionality
- Networks can be physically mapped using Google Maps and a traceroute feature
Cons:
- The interface needs works, specifically around the toolbar menus
The software's 30-day trial and paid versions can be downloaded here.
Pricing starts at $199.95 for a single computer license and can be viewed here.
8. Progress WhatsUp Gold
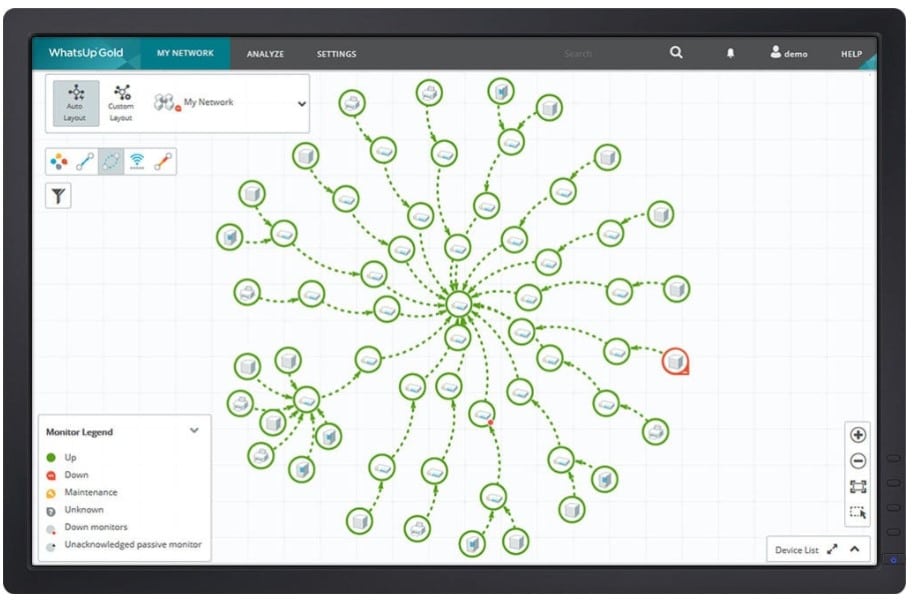
WhatsUp Gold is a network device and performance monitoring software, focused on the use of graphic representations in dynamic, detailed network topology maps that are structured logically, easily interpreted and updated automatically through its auto-discovery capacities.
Key Features:
- Automated continuous discovery
- Detailed performance information
- Customizable topology maps
- Comprehensive alert system
Why do we recommend it?
WhatsUp Gold is recommended for its automated discovery and detailed network performance insights, coupled with customizable mapping and an efficient alert system, facilitating comprehensive network monitoring.
Discovery and mapping functions also extend past the devices on your premises, including both cloud services and infrastructure on remote sites, providing a centralized map to unify all operations, services and equipment for instant viewing of the overall health of the network.
WhatsUp Gold logs all devices and their connectivity in your network through a process of automated continuous discovery, its registries interpreted and new devices, changes found updated into network topology maps without the need for manual intervention.
Auto-discovery can be run on-demand or set up on a schedule basis, the results of which assist in visualizing the entire network topology with accuracy.
The standard map provided by WhatsUp Gold can show Layer 2 and 3 devices, servers and the links between them, with each device represented by a circular icon, the rim of which reveals the status of the device, green showing good health and red depicting problematic areas.
All devices in the maps are clickable, which will reveal detailed performance and diagnostic information on the devices, enabling the ability to resolve issues detected faster. WhatsUp Gold can also assist further in troubleshooting with its Layer 2/3 trace and finder.
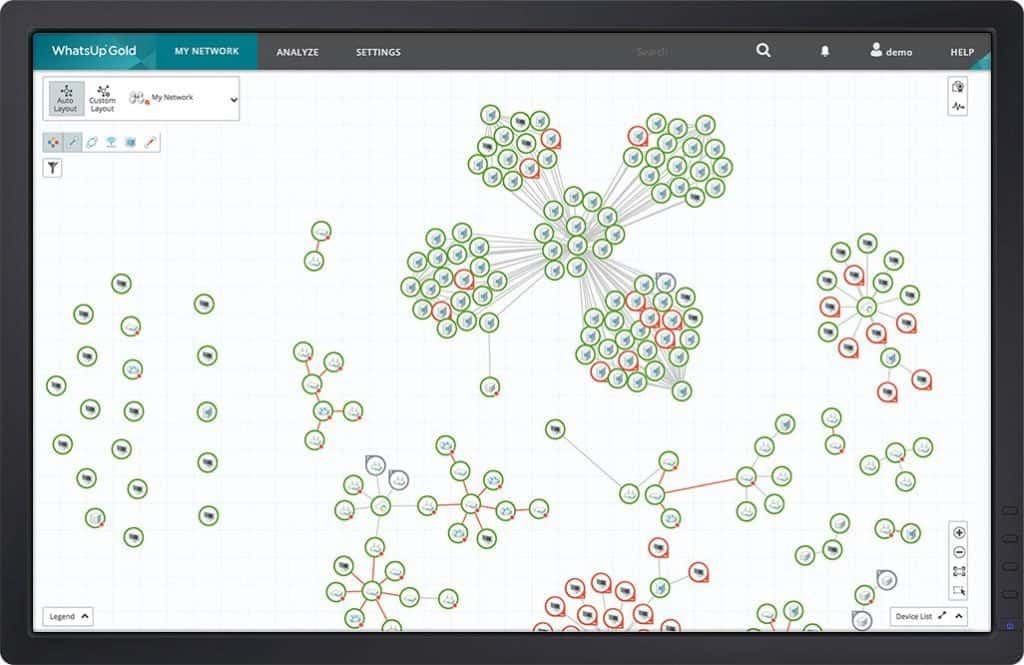
The network topology maps are also customizable to make the readability of the layout easier for the monitoring and health viewing of the network and include the option to show the traffic flow and status of a particular protocol or application.
With historical reports kept on access point subscriptions, signal strengths and hardware health within the network, WhatsUp Gold allows you to proactively address issues and trends with the aim of creating better workflow across the network.
The alerting system used by WhatsUp Gold also helps with visibility with the use of email notifications of alerts of changes and issues arising in the network, and additionally provides the option of tracking your network via the WhatsUp Gold mobile app, which on one screen can display devices up, down or in maintenance, giving you instant access to device details and the ability to resolve issues even if you are out of the office.
The WhatsUp Gold Mobile App is available for iOS and Android. This is available on Windows Server 2008 R2, 2012, 2012 R2 as well as 2016.
Who is it recommended for?
It's best suited for network administrators who require a detailed and holistic view of their network’s health, particularly those managing complex and diverse IT infrastructures.
Pros:
- Great interface
- Supports a wide range of flow-enabled devices
- Can support both virtual and physical hardware
- Balances user experience with monitoring features quite well
Cons:
- Free version can only monitor up to five resources
The free trial version for WhatsUp Gold can be downloaded here.
The paid version of WhatsUp Gold comes in three different packages, dependent on requirements, and quotes for these can be found here.
9. Faddom
Faddom is a software package that is able to discover, document, and map IT assets, which is necessary for ITIL asset management requirements and other tasks, such as application tracking.
Key Features:
- Asset tracking capabilities
- Automated inventory management
- Application dependency mapping
- Network traffic reporting
Why do we recommend it?
Faddom is recommended for its strong asset tracking and automated inventory management features, as well as its capability to map application dependencies, making it a versatile tool for IT asset management.
The system searches out all devices that run the network, which includes switches, routers, and appliances. It will also identify all endpoints, including desktops and servers. All of those pieces of equipment get written up in an asset inventory. If you change the infrastructure of the network, the tool will spot that alteration on its next sweep of the network and alter the inventory accordingly.
The asset inventory forms the basis of an automated system mapping feature. The network topology map that results from this process also gets automatically updated if anything changes on the network. These updates don’t need to be requested – they are automated and run on a regular basis.
The Faddom system scans will also search through each device and document the firmware or operating system of each. It also scans endpoints for software and creates a software inventory. This can be used as the basis for patch management and license management.
Information in the hardware and software inventories will help you calculate depreciation and plan for replacements. The system will help you implement ITIL standards for IT asset management.
As well as documenting physical infrastructure, Faddom is able to map virtual infrastructure, showing the relationships between virtual servers and virtual machines. The tool can also map a virtual network across the internet, linking sites and reaching out to cloud assets.
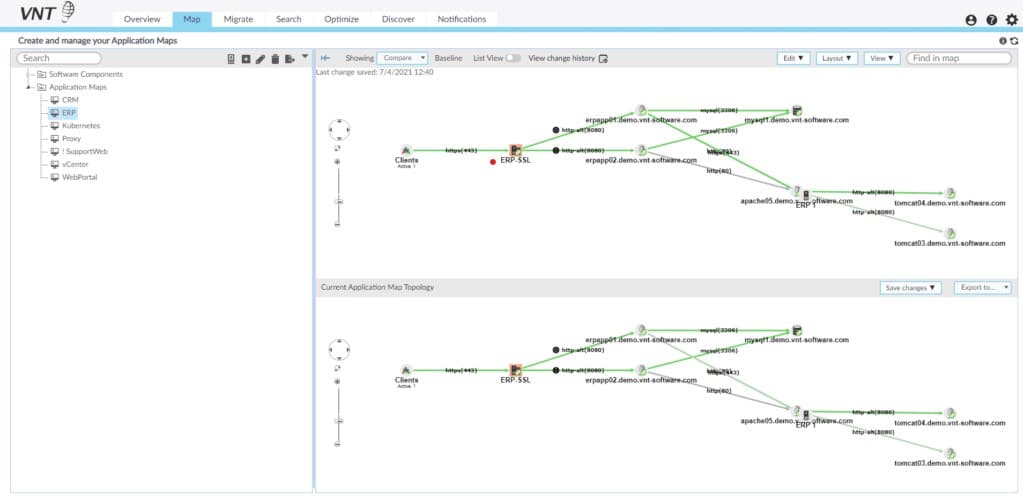
Faddom isn’t just useful for network mapping. It is also able to implement application dependency mapping. This is a complicated task that starts with a known system, such as a website, and then identifies calls to other modules. These supporting units might be provided as frameworks, APIs, or plug-ins, and they from for other programs running on servers that could be anywhere and owned by other companies. Those services might also depend on other modules, or microservices, that are provided by other companies.
The application dependency map the Faddom produces will help you monitor the hidden parts of your mobile apps or web applications and then secure them.
Faddom is an asset tracking system that provides network traffic reports, showing the capacity and utilization of each network device and cable stretch.
The dashboard for Faddom shows the network map and each node shown in the plan offers a click-through path to details on the device that it represents.
Faddom runs on a VM, which is proprietary and gets downloaded as part of the software installation process. That means the Faddom software can run on any operating system.
Who is it recommended for?
This tool is ideal for IT professionals involved in asset management and application tracking, especially those working in environments where understanding the relationship between different IT components is crucial.
Pros:
- Simple yet intuitive interface
- Maps networks out through easy-to-read line graphs
- Features automated inventory management
- Can easily visualize network changes over time
Cons:
- Best for small to mediums sized networks
The pricing for Faddom is based on the number of nodes that you want to monitor, there are two plan levels for the service, called Basic and Standard. You can download a free trial.
10. NetBrain
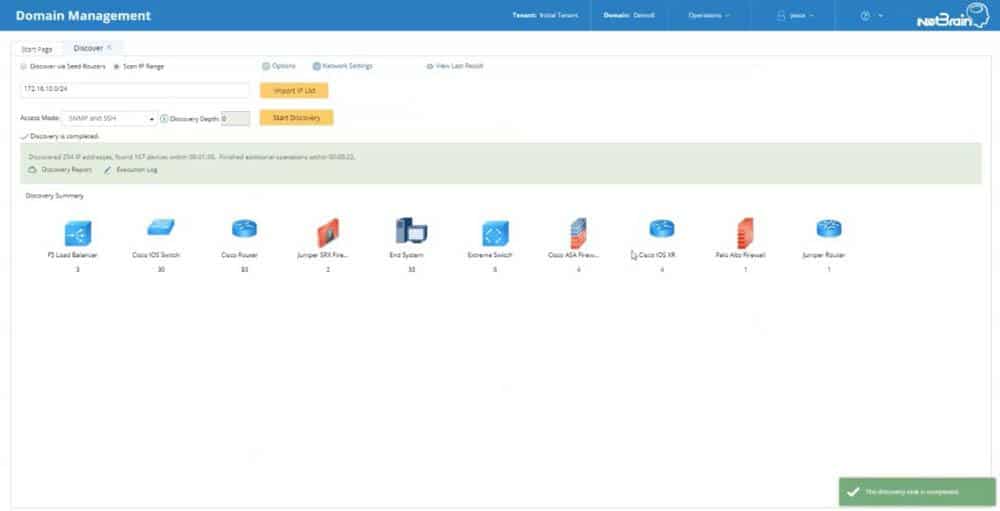
NetBrain is a network automation platform designed for large-scale businesses and has the ability to handle networks containing hundreds of concurrent users and thousands of network nodes, scaling these vast networks to visually organize them, distributing the load among multiple network servers and work spaces.
Key Features:
- Large-scale network handling
- Customizable automation features
- Real-time network mapping
- Comprehensive diagnostic tools
Why do we recommend it?
NetBrain is recommended for its ability to handle large-scale networks with customizable automation features and real-time mapping, providing comprehensive insights for complex network environments.
This is all done with the aim of automating repetitive tasks to assist network administrators in the effective management of documentation, changes, cyber-security and troubleshooting.
By scanning the network through the IP address of an authoritative router, NetBrain discovers and creates inventories of devices on your network automatically, finding routers, switches, firewalls and others in addition to endpoints, mapping the network and producing an overview of the entire network topology.
NetBrain can be set up to scan the network on a schedule, also allowing for on-demand scanning, and can discover up to 2000 devices per hour as well as Level 2 and 3 network infrastructure.
Its automation features are fully customizable for the adaption of both the specific needs of your network and all tasks performed. Results from network data collected and correlated can further be reported directly on the topology map.
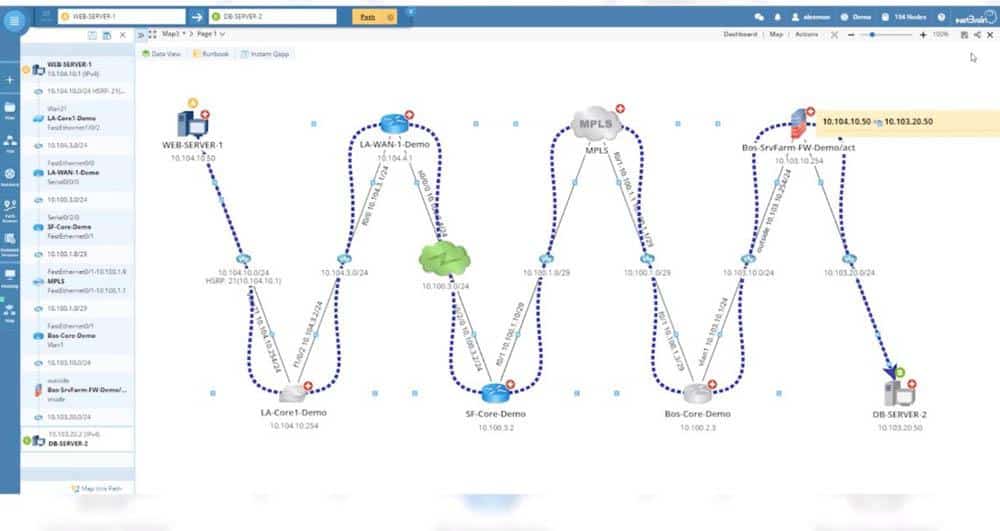
NetBrain maps out all environments, including physical, virtual, SDN and hybrid environments, and will create the network map and the network’s path in real time, presenting the map in a dynamic, graphical form, allowing for the easier identification of bottlenecks in network traffic, amongst other potential issues in the network.
Snapshots of the network can also be captured by NetBrain at scheduled intervals, used in the cataloging of historical data within the network, assisting in troubleshooting through the easier identification of changes made to the inventory, routing, configuration and CDP/ ARP/ MAC/ Spanning-Tree, made even faster by the option to highlight and visualize all changes on the topology map.
There are also multiple profiles built into NetBrain to further assist in troubleshooting as well as templates which can define changes, automatically apply changes to several devices in a single click, instantly document change history and analyze the impact of these changes throughout the network through the comparison of data between pre and post-change snapshots.
NetBrain is available for Windows environments.
Who is it recommended for?
This tool is particularly suited for network professionals managing large-scale, complex networks who require customizable and automated solutions for efficient network management.
Pros:
- Simple graphics get the job done without cluttering the dashboard
- Autodiscovery can automatically identify Cisco ACI and other devices
- Provides insights through automatic diagnostic scans
- Great for mapping out complicated environments
Cons:
- Must contact sales for pricing
A trial version of NetBrain can be downloaded here.
To request a quote or demo for the different editions of NetBrain, you can click here.
11. Opsview Monitor
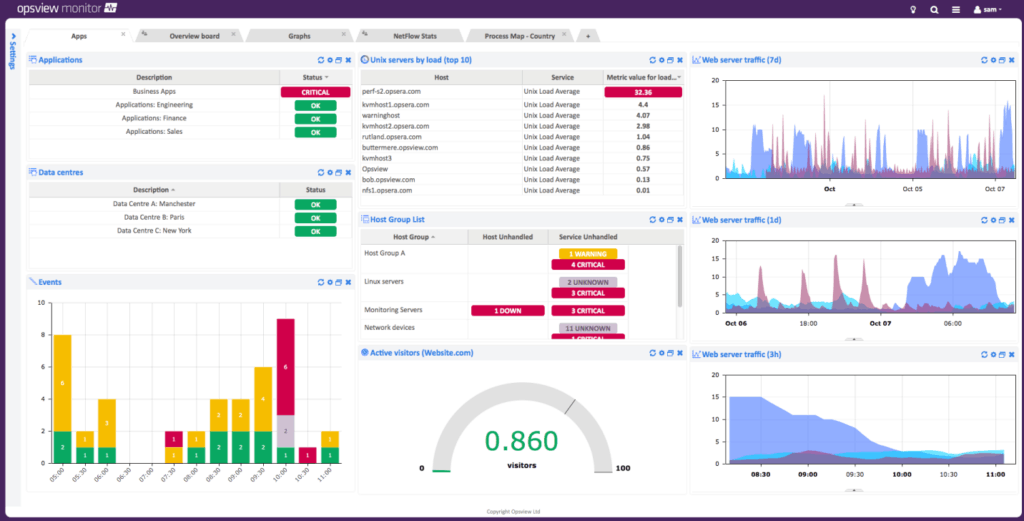
Opsview Monitor is a cloud and infrastructure monitoring software with the ability to monitor tens of thousands of hosts, growing and scaling horizontally on physical or virtual infrastructure through its use of distributed architecture, which in turn aids affordability, while the automation of IT management operations aims to save time and resources in the monitoring and mapping of networks.
Key Features:
- Scalable distributed architecture
- Customizable network maps
- Efficient auto-discovery function
- Bulk configuration capabilities
Why do we recommend it?
Opsview Monitor is recommended for its scalability and customizable mapping features, along with efficient auto-discovery and bulk configuration capabilities, making it ideal for comprehensive network monitoring.
Opsview Monitor displays real time data and alerts in its dashboard, presenting data collected through the scanning and mapping of the network visually through the use of graphs, event tables and graphical maps, which can be configured to suit specific requirements.
Dashboards can also be created per data center, office and customer, amongst others, allowing the view of overall network performance and health individually, all of which can be displayed via TVs throughout the office for instant, quick glance surveying of networks.
Maps can be customized to meet specific needs, with the option of uploading images, such as floor plans, server racks or geographical maps and overlaying the throughput of all network devices with chosen data, making the visualization of network topology, devices in the network easier and speeding up the identification of issues which leads to faster and more efficient troubleshooting.
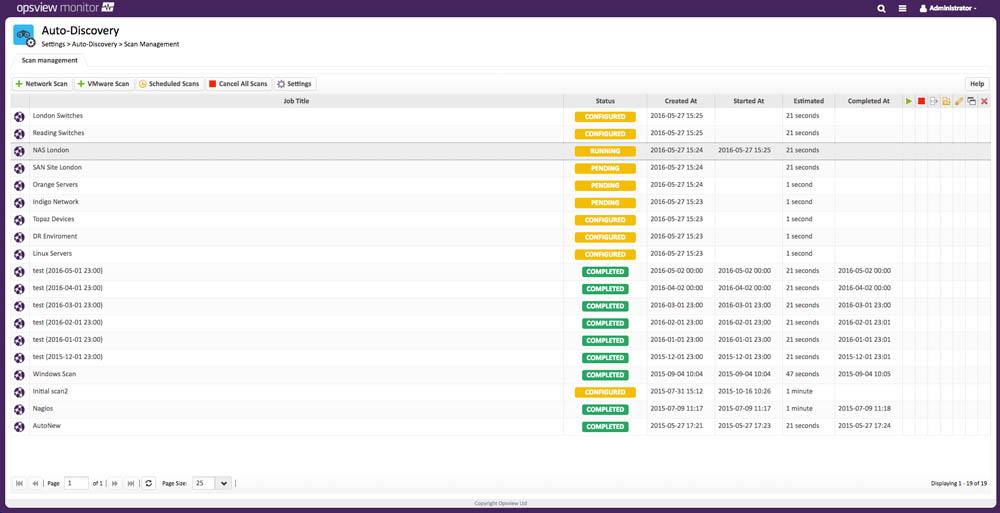
Opsview Monitor’s auto-discovery feature scans the network via a range of IP addresses or DNS names, using the data to map the entire network, creating an inventory of all devices, hosts and profiling them, and can be scheduled to scan at specified intervals to ensure inclusion of all new devices, with the ability to add thousands of devices in minutes.
Opsview Monitor further allows for the bulk configuration of hosts discovered, with the option of adding hosts to groups, defining host templates and the inclusion of hosts in hash tag groups, while retaining all data gathered for several days.
This can be used for the reporting on trends and performance results, allowing for the analyzing of historical data which can be used to construct smoother running networks.
Opsview Monitor is supported on Linux and Windows environments, amongst others.
Who is it recommended for?
It is best suited for IT managers overseeing large and distributed networks, requiring a tool that can scale effectively while providing detailed insights and monitoring capabilities.
Pros:
- Supports J-Flow, NetFlow, and other probing methods
- Highly customizable interface
- Offers premade sensors – great for getting started right away
- Clean, easy-to-use interface
- Supports a free and paid version
Cons:
- Better suited for larger networks
You can download the free version of Opsview Monitor here and the demo version here.
The paid subscription plan for Opsview Monitor starts at $89.95 per month which can be viewed here.
Conclusion
The combination of Network Mapping and Auto-Discovery tools, as shown in the breakdowns here, provide a reliable and essential service to companies and organizations aiming for the effective use of time in completing network maintenance, trouble shooting and monitoring tasks.
All while keeping information accurate and up to date as networks grow and alter continuously.
The type of solutions and frequency at which auto-discovery tools should be used for scanning mapped networks will alter dependent on the size and nature of companies and organizations.
Developing a consistent schedule is crucial for the efficient and successful tracking, monitoring and maintenance of networks, and we hope the information gathered here helps in choosing the best solution to suit your needs.
Network Mapping Software FAQs
What are some common network mapping tools?
Common network mapping tools include tools such as SolarWinds Network Topology Mapper, PRTG Network Monitor, and NetBrain.
How does network mapping work?
Network mapping works by scanning the network for devices and connections, and then creating a visual representation of the network based on the scan results.
What types of information can be gathered from network mapping?
Using network mapping, administrators can gather information such as IP addresses, device types, network topology, and device configurations.
Can network maps be used for network security?
Yes, network maps can be used for network security by identifying potential security threats and vulnerabilities, and by providing visibility into network security policies and access controls.
Can network mapping tools integrate with other network management tools?
Yes, many network mapping tools can integrate with other network management tools such as network performance monitoring, configuration management, and security information and event management (SIEM) tools.
What types of visualizations are available for network mapping?
Network mapping visualizations can include network diagrams, topology maps, and geographic maps.
What are some considerations when selecting a network mapping tool?
Considerations when selecting a network mapping tool include ease of use, scalability, compatibility with network infrastructure, support and documentation, and pricing and licensing options.

