
Waiting around for a key network server, Switch or Router to fail is not a good way to maintain your network uptime and key resources online – For this reason alone, you need a Robust LAN Monitoring Software that will help you Prevent downtime before it occurs!
With the right set of software and tools at your disposal, you will quickly take back control of your organization’s operating environment, and all of the detail you could possibly need will soon be at your fingertips.
Here is our list of the best LAN monitoring tools:
- ManageEngine OpManager – EDITOR’S CHOICE This software package can be installed on your own servers (Windows Server or Linux) or on a cloud account (AWS or Azure) and it provides network device monitoring and also server monitoring. Access a 30-day free trial.
- Paessler PRTG – FREE TRIAL excels in providing an integrated monitoring solution with dynamic adaptation to IT environments. Start a 30-day free trial.
- Site24x7 – FREE TRIAL This cloud-hosted platform implements LAN monitoring as part of a full stack monitoring package. Start a 30-day free trial.
- SolarWinds Network Performance Monitor Stands out for its automated network discovery, intuitive web interface, and comprehensive monitoring tools.
Perhaps your SFTP Server Hard drive or File Server is running out of space, or your terminal server is running dangerously low on system memory: LAN monitoring can definitely help.
Whether you need graphical insight into what is going on in your operating environment, or automated warnings and alerts when something is about to go wrong, there are a wide variety of tools on the market that will help you to get the job done effectively and efficiently.
We will be looking at the best such tools for keeping an eye on your internal network, and what some of the most important features of each one is.
The Best LAN Monitoring Tools
Our methodology for selecting the best LAN Monitoring tools:
We've broken down our analysis for you based on these key criteria:
- Network discovery and monitoring efficiency
- User interface intuitiveness and ease of use
- Customization and alert system capabilities
- Pricing and value for money
1. ManageEngine OpManager – FREE TRIAL
ManageEngine have created a tool that allows you to easily manage your LAN and devices on your LAN: OpManager. Its primary function is that of an infrastructure management tool, and as such will provide you with all of the network information that you could possibly need to maintain and manage your network.
The application allows administrators to see data on the network such as server resource allocations, network performance, and application behavior, and is all accessible from a web based feature that provides a search function for finding specific errors and warnings. From here you can also manage your alerts and fine tune your setup.
Key Features:
- Efficient device discovery
- Integrated API for software compatibility
- Detailed resource monitoring
- SNMP-based device monitoring
- Network troubleshooting tools
Why do we recommend it?
ManageEngine OpManager is recommended for its effective network management and detailed monitoring capabilities.
OpManager has an API that allows it to integrate with other software packages such as Helpdesk and other ManageEngine products, allowing data to flow to and from all of your supported applications. This allows your alerts and triggers from failed devices on your network to log support tickets, send emails, send messages and alert your IT staff about any potential problems.
Because this software is designed to help prevent downtime, these messages will often warn you way in advance about any potential problems. Device discovery works flawlessly once the software has been installed.
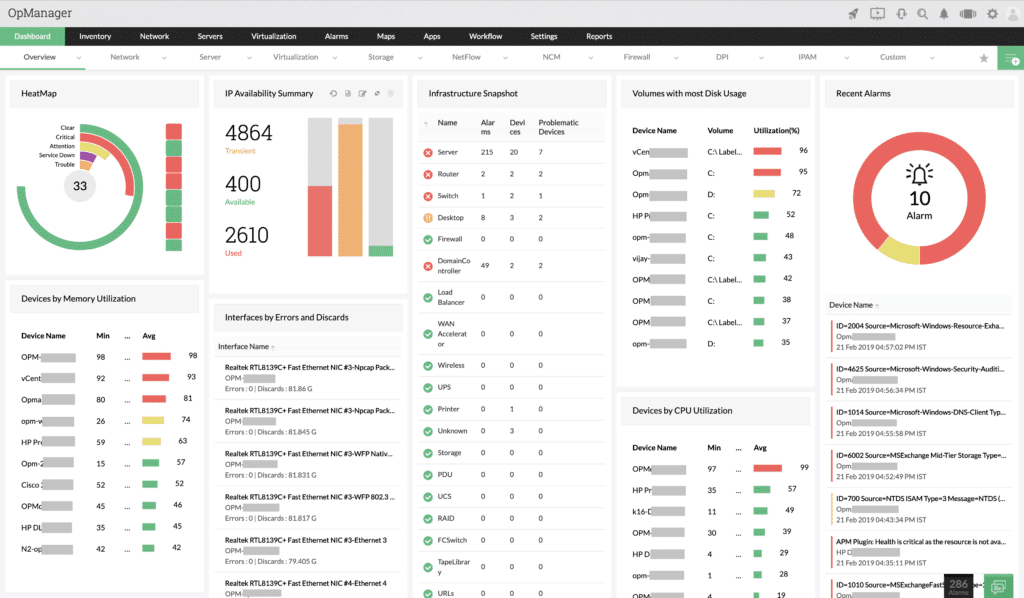
Simply specify the IP ranges that you wish to scan and then sit back while all of the devices are added to your inventory. Once all of your devices have been added, you will have access to them via the web interface, which specifies important information such as server utilization in both CPU, and RAM, and for critical issues such as hard drive space and network activity.
This console acts as a centralized dashboard that is easy to navigate. When an issue occurs, simply highlight the device and drill down into more detail to see exactly what is happening on your network.
Who is it recommended for?
Ideal for IT administrators looking for a comprehensive tool to manage and monitor LAN infrastructure with proactive alerting.
Pros:
- Can monitor bandwidth consumption as well as alert to configuration changes that could impact network performance
- Can monitor bandwidth and resource consumption on the application level, and even drill down to identify specific users consuming the most resources
- Supports email, SMS, and webhook for numerous alerting channels
- Integrates well in the ManageEngine ecosystem with their other products
- Server monitoring
Cons:
- Takes time to full explore all the options available in the ManageEngine software suite
Price: Pricing starts at $945 for 100 sensors, and if you need more information, or have a bigger environment, then you can request a personalized quote. You can also download the software on a 30-day free trial to work out your requirements.
EDITOR'S CHOICE
ManageEngine OpManager is our top pick for a LAN monitoring software package because it provides an all-encompassing, user-friendly solution to monitor and manage local area networks (LANs) with efficiency and precision. Offering a comprehensive range of features, OpManager allows businesses to keep a close watch on network performance, optimize resource utilization, and ensure minimal downtime. It is specifically designed to handle the complexities of modern LAN environments, delivering real-time insights into network health and performance. One of the key advantages of OpManager is its ability to monitor all network devices within a LAN, including switches, routers, servers, and workstations, without requiring additional agents or complex configurations. Through its agentless approach, OpManager ensures automated monitoring, saving time and reducing administrative effort. It automatically discovers devices on the network and updates the network topology, making it easy for administrators to track and manage their entire LAN infrastructure. OpManager also provides real-time network monitoring and visualizations, helping administrators track key performance metrics like bandwidth usage, device health, traffic flow, and latency. The platform’s well-planned dashboard makes it simple to view data, identify issues, and resolve them before they impact operations. Customizable alerts are also a significant feature, notifying IT teams when performance thresholds are breached or when any device is experiencing issues.
Download: Get a 30-day FREE Trial
Official Site: https://www.manageengine.com/network-monitoring/download.html
OS: Windows Server, Linux, AWS, and Azure
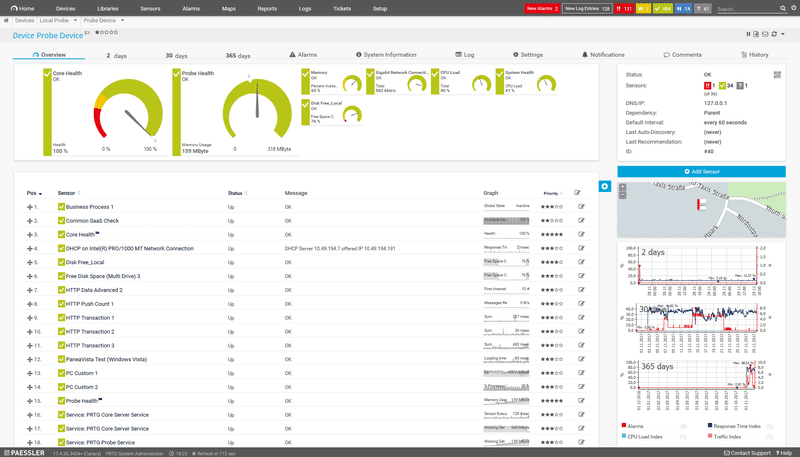
2. Paessler PRTG – FREE TRIAL
Paessler PRTG Network Monitor is an all in one monitoring tool that easily keeps an eye on all of your Lan Infrastructure. There tool is an excellent choice for anyone that wants to see how they can monitor their existing equipment on the network, and there is even a free version of the software that gives users a maximum of 100 sensors to work with.
The software itself enables users to monitor critical services such as mail server monitoring (specific service monitoring for web, mail, database and virtual servers), and gives you full control 24 hours a day.
Key Features:
- Dynamic integrated solution
- Advanced alert system
- Capacity planning tools
Why do we recommend it?
Paessler PRTG is recommended for its all-in-one monitoring capability, supporting diverse LAN infrastructure needs effectively.
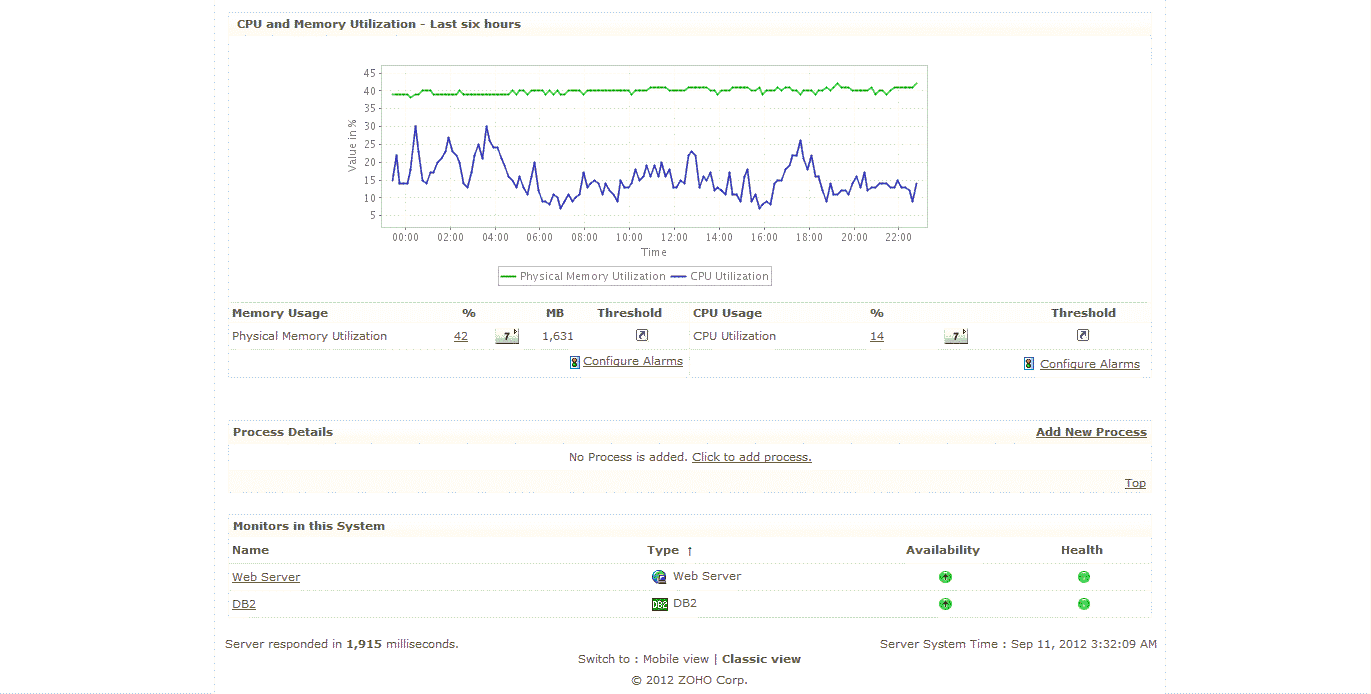
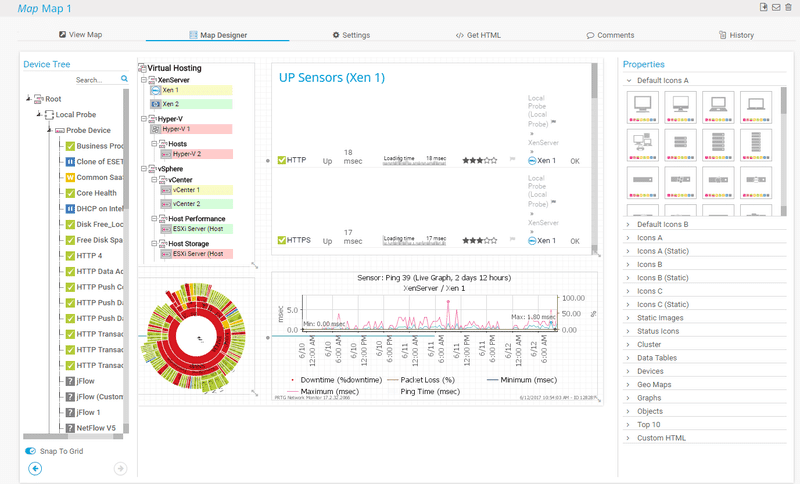
PRTG operates in three main ways. Firstly, as an integrated solution. This means that it can adapt dynamically to the environment that you operate in. So whether you are downsizing or up-scaling, PRTG can help you to keep an eye on things such as server CPU temperatures and fan speeds, CPU and memory usage, hard disk space and much more.
There is automated switch and router failure functionality as well, so if a vital piece of your network starts to malfunction, you will be the first to know about it. Even your virtual infrastructure is taken care of, so VMs are always being watched.
The next area that PRTG makes things easier for users is with its alert system. There is email and SMS functionality so that if a server starts to misbehave, or generate errors, then the appropriate member of your team will be notified immediately, even if they are away from the office.
This is especially useful for starting the troubleshooting process, as the alerts will generally be able to point you and your team in the right direction as to what the cause of the outage could have been.
The third way that PRTG is able to help is with capacity planning. By monitoring your current usage stats on your local servers and infrastructure, PRTG is able to help you identify where your company needs to start investing in greater capacity and capability.
Charts, graphs and data are all available via the dashboard, so when it comes time to present your case to the financial director, you will have all of the information that you need to state your case effectively for a budget approval.
PRTG is a great tool for monitoring your network, and keeping an eye on the operational aspect of the environment as a whole. The free version is an excellent testing tool for anyone looking to improve the way in which they support their LAN with monitoring and reporting tools.
Who is it recommended for?
This tool is suitable for those seeking comprehensive LAN monitoring, from small-scale operations to large enterprises.
Pros:
- Drag and drop editor makes it easy to build custom views and reports
- Supports a wide range of alert mediums such as SMS, email, and third-party integrations into platforms like Slack
- Supports a freeware version
Cons:
- Is a very comprehensive platform with many features and moving parts that require time to learn
Pricing is free for 100 sensors, and starts at $1,600 per 500 sensors in the paid version. You can start with a 30-day free trial to work out the requirements of your network.
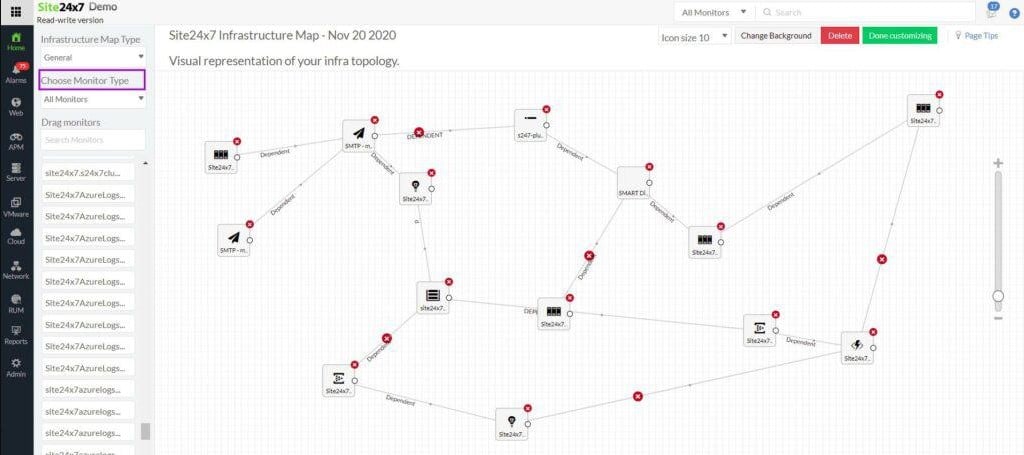
3. Site24x7 – FREE TRIAL
Site24x7 is a cloud platform that provides both network device status checks and traffic analysis. The entire package sets itself up through an autodiscovery process. That compiles a hardware inventory and generates and network topology map. The discovery cycle repeats frequently, automatically updating the system documentation.
Subscribers to Site24x7 get access to every module on the platform. That gives you endpoint and application monitoring as well. You also get utilities to track the performance of internet links between sites and to cloud platforms.
The device monitoring service relies on the Simple Network Management Protocol. It calls in other protocols as well, such as WMI and ICMP (Ping). This combination enables the service to receive regular summaries of device performance from switches, routers, hardware firewalls and other devices on the network. The system also gathers alerts from SNMP device agents. Alerts can be forwarded to technicians as notifications by email or SMS.
Key Features:
- Autodiscovery
- Network device monitoring
- Traffic analysis
- Alerts and notifications
Why do we recommend it?
Although Site24x7 is equipped to monitor a wide range of technologies, LAN monitoring it its core skill. The package excels at the task and all of the connected monitoring tools on the platform improve the information available about the entire experience of users – even visitors to your business’s websites.
The cloud-based platform installs a collector program on one of your servers – this process takes place during onboarding. This unit collects network performance data and uploads it to the Site24x7 cloud server. While collecting network device data, that agent also uploads information about traffic flows, application activity, and endpoint performance information.
A LAN is a wired network but you may well have wireless sections on your site. Site24x7 can monitor them. It can also monitor the performance of virtualizations. The package’s network traffic analyzer uses flow protocols, such as NetFlow sFlow, and J-Flow to extract throughput and total capacity information. That data is stored for future comparison, enabling network engineers to identify peaks and troughs in activity per network location and over time. That’s a useful assistant for capacity planning.
The package also includes a network configuration manager. This enables you to standardize device settings, refer to the network topology map to create access control lists for zones of trust, and also protect device configurations against tampering or accidental changes.
You also get a log manager with the Site24x7 package. That can provide extra information about network activity. The logs from your network, together with SNMP reports can be forwarded to a SIEM. You can also store log messages for compliance auditing.
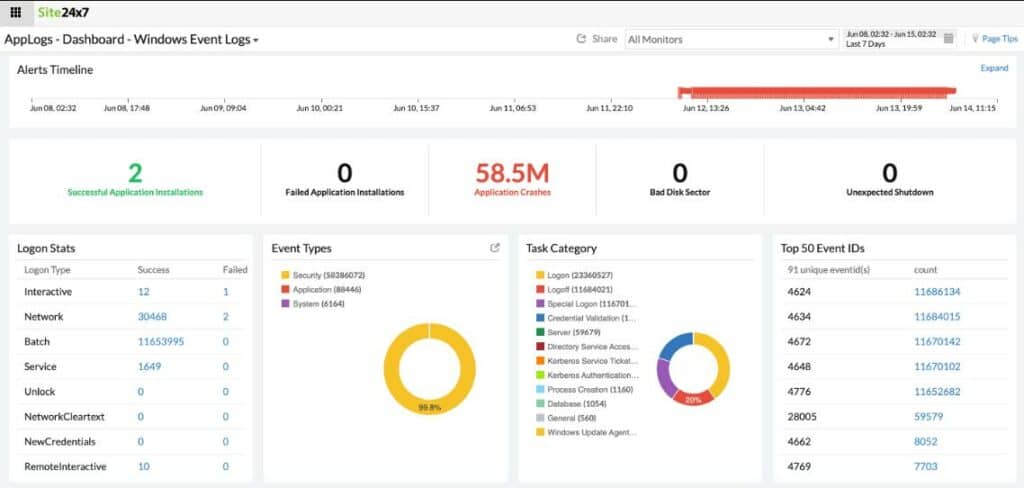
Site24x7 hosts the system console in the cloud. Each user gets associated storage space for statistics to enable analysis of events over time. As it is a cloud platform, each account’s storage space is kept private through encryption and access credentials. The platform also provides an MSP edition, which enables the creation of sub-accounts – in that case, the data of each client is kept separate.
The console can be customized and many other aspects of the tool can be tailored. For example, the triggers for alerts can be altered and it is possible to set up new alert conditions for extra alerts. Users can rearrange the panels on a standard screen or replace existing sections, possibly altering the display media for the same statistic. The package comes with a library of reports, but it is also possible to create your own.
As well as automated monitoring for LANs, the Site24x7 package provides connection testing tools. These give you the ability to test links across the network or over the internet. The package of tests can also be set up to run continuously and you can create an alert to trigger if an availability test fails. Tests can also be set up for website availability and there are walk through tests that try out interactive elements on a Web page.
Who is it recommended for?
The Site24x7 package is suitable for companies of all sizes. The platform is offered in many plans with the contents of all of them more or less the same. The allowances for monitoring different types of assets are the main differences between them. So, any business would find this package accessible.
Pros:
- Customizable screens, reports, and alert conditions
- Network configuration manager
- Log manager
- A cloud-based system
Cons:
- Not available for on-premises hosting
All plans are sized and priced to suit the smallest businesses. For example, the Infrastructure Monitoring edition is priced at $9 per month. That would be ridiculously cheap for a large network and, as you would expect, it isn’t suitable for such businesses. Blogger companies have to pay extra for greater capacity – in the case of network monitoring to cover more nodes. You can check out the Site24x7 system by accessing a 30-day free trial.
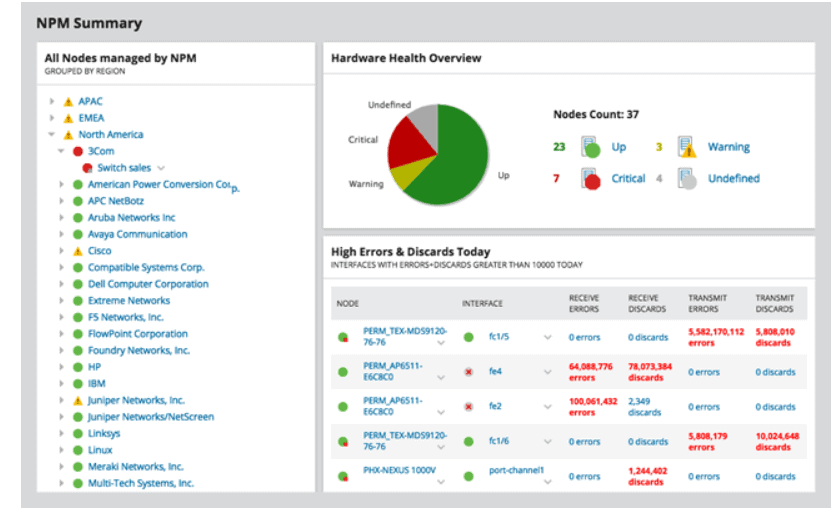
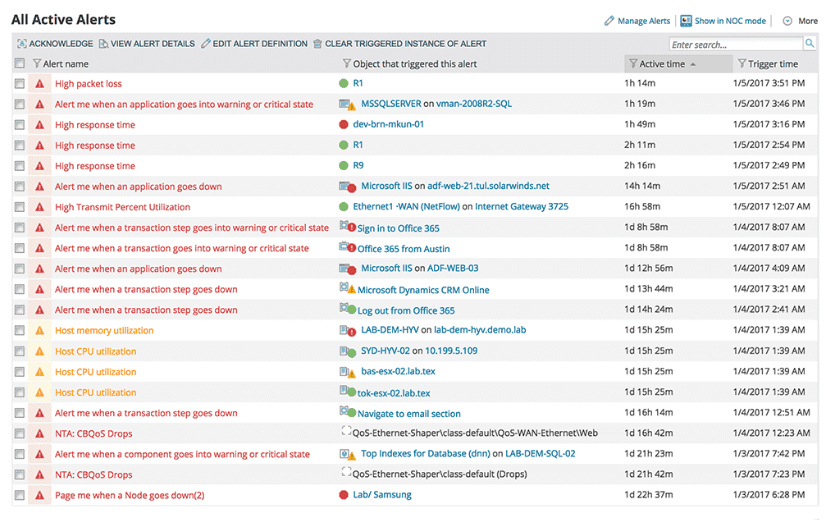
4. SolarWinds Network Performance Monitor
SolarWinds Network Performance Monitor is a great tool for businesses that need to enhance their IT department’s monitoring capabilities. This product has excellent capabilities and is acts as both a monitoring tool and a troubleshooting utility. The entire system is accessible via a clean and intuitive web interface.
Key Features:
- Automated network discovery
- Intuitive web interface
- Customizable monitoring
- Extensive virtual machine tracking
Why do we recommend it?
SolarWinds Network Performance Monitor is recommended for its superior network discovery and monitoring capabilities, complemented by an intuitive and customizable interface.
Installing the software is easier than ever, and thanks to the inclusion of an online installer, users are ensured of the latest version of the installation software whenever they choose to load it onto their monitoring server.
The entire process is guided and automated, and all that is needed are the login credentials for your Active Directory server, VMWare administration details and the specific IP address ranges that you wish to scan. Once all of this information has been entered in, the application goes ahead and performs all of the network discovery tasks on its own.
Once all of the devices have been discovered, users can customize which elements they want to keep tracking, and can discard unwanted devices from the monitoring list. Users may find that they are overwhelmed by a barrage of information in the beginning, but with careful refinement and setup, any unwanted information can be easily discarded, and the key details of your environment will take on a more visible position in the web console.
Virtual Machines can be monitored easily, as well as their system resource consumption and activity all the way down to the host’s hardware level. Information such as Network Transmissions, CPU and Memory utilization are all visible on an easy to read graph.
Network activity is dissected into graphs and data, and can tell administrators exactly what activity is happening on the network. Network performance such as latency, Network/Bandwidth throughput and speed is all visible from a single point, making it easy and convenient for viewing.
All of these features combined creates an easy to use application that adds value and visibility to the network, and provides essential monitoring tools for IT professionals that need to monitor both big and small networks.
Who is it recommended for?
It's ideal for IT professionals in businesses of all sizes needing comprehensive network monitoring and troubleshooting tools.
Pros:
- Supports auto-discovery that builds network topology maps and inventory lists in real-time based on devices that enter the network
- Has some of the best alerting features that balance effectiveness with ease of use
- Supports both SNMP monitoring as well as packet analysis, giving you more control over monitoring than similar tools
- Uses drag and drop widgets to customize the look and feel of the dashboard
- Tons of preconfigured templates, reports, and dashboard views
Cons:
- This is a feature-rich enterprise tool designed for sysadmin, non-technical users may some features overwhelming
You can start with a 30-day free trial.
Conclusion
Being in control of your LAN Environment means more than just having the tools to fix things when they go down. In order to truly understand the current state of your environment, you need to have full monitoring and reporting tools at your disposal. Whenever a key application fails, or a critical server crashes, or a vital service on a server fails, your company will inevitably start to lose money.
The time that you and your team spend fixing problems could be more effectively used with other work, which means that your company loses out on more productivity, which incurs additional monetary losses for your department, and for the company.
Monitoring your LAN is the only way to catch problems before they become massive issues, and when you are in control of your network, you are able to anticipate, plan for, and mitigate any issue that could come your way, both with your servers, and your network infrastructure as a whole.
Once your LAN Monitoring Software is in place, you can say goodbye to intermittent server and network appliance outages, and Hello to a more productive and efficient IT department. We suggest you try one (or All) of the Tools listed above and let us know how it goes!
LAN Monitoring Software FAQs
What are some common tools used for LAN monitoring?
Some common tools used for LAN monitoring include Wireshark, SolarWinds Network Performance Monitor, and PRTG Network Monitor.
How can organizations ensure that they are monitoring their LAN in real-time?
Organizations can ensure that they are monitoring their LAN in real-time by using automated monitoring tools and setting up alerts to notify administrators of potential issues or security threats.
What are some common types of network traffic that should be monitored?
Common types of network traffic that should be monitored include HTTP, HTTPS, FTP, SMTP, and DNS traffic.
How can organizations use LAN monitoring to optimize network performance?
Organizations can use LAN monitoring to identify potential bottlenecks or issues that are affecting network performance, and take proactive measures to address these issues before they become major problems.
Can LAN monitoring help organizations to improve network security?
Yes, effective LAN monitoring can help organizations to identify potential security threats in real-time, allowing them to take proactive measures to protect their network and prevent data breaches.
What are some common challenges associated with LAN monitoring?
Common challenges associated with LAN monitoring include the complexity of modern IT environments, the sheer volume of network traffic, and the need to balance security with business needs.
Related Post: Best Bandwidth Monitoring Tools


