The JBoss application server, developed in Java EE, is an open-source, cross-platform Java application server, used for the building, deployment and hosting of highly transactional Java applications, services and business components. While it relies on the Enterprise JavaBeans specification for functionality, it intends to deliver effective, continuous performance and enterprise-class platforms for all e-business applications.
The JBoss application server supports the effort of uninterrupted application performance through its essential provision of security, resource management and transactional support, as well as load balancing and clustering.
In this aspect, it also becomes crucial to monitor the JBoss application server, the infrastructure tiers supporting it and its hosted components constantly.
Here is our list of the best JBoss Monitoring tools:
- SolarWinds Server & Application Monitor – FREE TRIAL This on-premises monitoring system is able to supervise the operations of JBoss and other applications whether running on-premises or on virtual servers. Installs on Windows Server.
- ManageEngine Applications Manager – FREE TRIAL This tool can monitor applications written in Java and supported by JBoss. Runs on Windows Server and Linux.
- Site24x7 Application Performance Monitor – FREE TRIAL A cloud-based monitoring system that can track the performance of applications written in Java and the other applications that interact with them.
- GroundWork Monitor An infrastructure monitoring tool that includes the support for the developers and users of JBoss-managed applications. Installs on Linux.
- Nagios XI A system monitoring tool that includes the ability to monitor Java applications that are managed by JBoss. Installs on Linux.
- eG Enterprise A cloud-based system monitor that supports virtual machines, Java applications, and the JBoss framework.
- Dynatrace A cloud-based infrastructure monitoring service that specializes in application tracking, including those written in Java and supported by JBoss.
- AppDynamics A cloud-based applications monitor that can drill down through the app stack to identify the root cause of performance issues.
The use of additional tools and software allow for the automation of this complex task, which, due to the scalability of applications and servers, becomes a necessity. This lets administrators focus on the troubleshooting of issues identified, ensuring they are resolved before they affect the experience of end-users.
Centralized performance insight allows for an easy and instant overview of the Java environment, which further assists in the proactive detection of issues. The monitoring and measuring of the availability of applications to ensure uptime is line with service-level agreements is indispensible.
This minimizes and avoids the potential loss of finance as well as damage to reputation due to the JBoss application server or individual application downtime. Tools and software designed for this ensure that applications are not at risk from potential problems in servers and server behavior does not negatively influence their performance.
The additional tracking of application errors occurring, allowing administrators to react timeously, aids in the overall maintenance of applications and JBoss application server performance. This increases end-user satisfaction, with the aim of keeping error occurrences as low as possible.
The added ability to distinguish between JVM-level, container-level and code-level complications allows for easier identification of root issues. The scalability of monitoring tools and software further play a role in tracing the number of server instances running, particularly if applications scale up and down based on usage, and the ability to keep pace with demand.
They also monitor and alert administrators when CPU usage increases on servers, potentially slowing applications or the server down, through automated notification systems. Overall, in the case of managing and troubleshooting JBoss, the use of additional JBoss diagnostic tools and software notably speed up the process, improving availability and end-user contentment.
Keeping this in mind, we have gathered the best diagnostic tools and software for your perusal, detailing their capabilities and strengths, with download links and pricing structures listed beneath each tool.
Here's the Best JBoss Monitoring Software & Tools of 2025
Our methodology for selecting JBoss monitoring tools and software
We reviewed various JBoss monitoring tools and analyzed the options based on the following criteria:
- Support for various JBoss versions and environments
- Support for monitoring outside of JBoss
- A facility to analyze JBoss performance over time
- Graphical interpretation of data, such as charts and graphs
- A free trial period, a demo, or a money-back guarantee for no-risk assessment
- A good price that reflects value for money when compared to the functions offered
1. SolarWinds Server & Application Monitor
The JBoss monitoring tool included in the SolarWinds Server & Application Monitor ensures that the JBoss application server and applications run uninterrupted and at maximum performance. This in turn avoids downtime and slow servers or applications, assuring end-user contentment.
Key Features:
- Automated application discovery
- Real-time JBoss process management
- Intelligent baseline alerts
- Extensive IT infrastructure monitoring
Why do we recommend it?
SolarWinds Server & Application Monitor is recommended for its comprehensive approach to monitoring, featuring automated discovery and intelligent alert systems. These features ensure proactive management and high performance of IT infrastructures.
The SolarWinds Server & Application Monitor achieves this through its automated application discovery and server monitoring which allows it to deliver high visibility into health metrics.
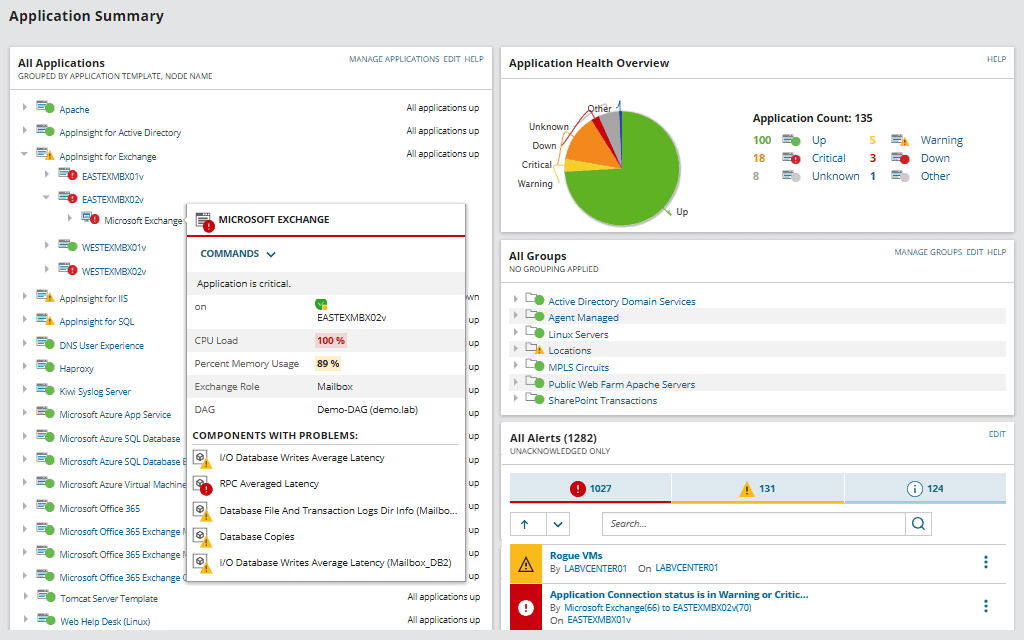
This makes the monitoring of server availability, performance and its vital components simpler and quicker for administrators, with the built-in AppStack dashboard providing the effective visualization of data collected. Application dependencies with underlying virtual and physical server environment are viewable with ease, assisting administrators in the identification and analysis of root causes of problems detected.
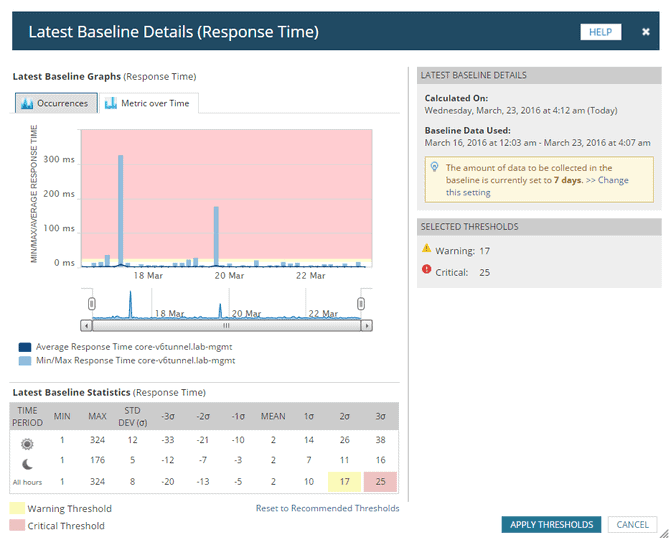
SolarWinds Server and Application Monitor uses JMX protocol to accumulate key performance metrics, such as packet loss, response time and latency, and further provides the additional benefit of intelligent baseline alerts. These warn of critical thresholds before they become an issue, allowing for fast and proactive troubleshooting, with detailed performance visibility aiding in the isolation of problems.
The option to view the JBoss application server processes and services in real-time, with the ability to stop, start or restart them remotely, also significantly speeds up the troubleshooting process.
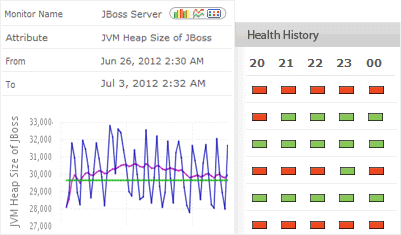
The extension of SolarWinds Server and Application Monitor’s monitoring capabilities to any home grown or custom applications running on the JBoss application server is seamless. It conducts the tracking of crucial memory statistics through an out-of-the-box monitoring template, with the aim of solving memory leaks in the Java runtime environment.
Monitoring of this aspect of the JBoss application server includes heap and non-heap memory, pending and pool memory, as well as total memory, garbage collection and more. The analysis of these statistics adds further efficiency to the task of solving issues discovered.
With the essential need for capacity planning in JBoss application servers, SolarWinds Server and Application Monitor tracks current and active thread metrics, user time, thread CPU time and available processes.
It also detects issues related to multi-threading, while monitoring classes loaded and unloaded count. It uses this information, as well as server hardware utilization for CPU, memory and disk, automatically forecasting when capacity will run out, allowing administrators to plan accordingly. Of course one of the best selling points with SolarWinds is the fact that it manage and monitor so many different aspects of your IT infrastructure.
Adding SolarWinds to your monitoring suite of tools will invariably result in a much richer monitoring experience, improving visibility and effectiveness overall in your operating environment. SolarWinds Server and Application Monitor additionally keeps track of hardware components, such as fans, temperature and power supply, in the effort of fast and accurate identification of potential failures and those already occurring.
Who is it recommended for?
This tool is particularly suitable for large enterprises or IT professionals who need a robust solution for monitoring complex IT environments, including JBoss application servers and various IT infrastructure components.
Pros:
- Designed with large and enterprise networks in mind
- Supports auto-discovery that builds network topology maps and inventory lists in real-time based on devices that enter the network
- Has some of the best alerting features that balance effectiveness with ease of use
- Supports both SNMP monitoring as well as packet analysis, giving you more control over monitoring than similar tools
- Uses drag and drop widgets to customize the look and feel of the dashboard
- Robust reporting system with pre-configured compliance templates
Cons:
- Designed for IT professionals, not the best option for non-technical users
Proactive monitoring is definitely what you get when you install a solution like this.
Price & Info:
You can download a free 30 day trial.
Download:
100% Free 30 Day Trial to Get you Started!
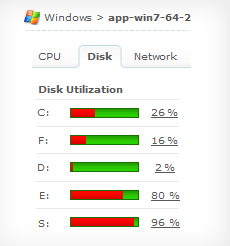
2. ManageEngine Applications Manager
JBoss Monitoring with ManageEngine Applications Manager, designed with simplicity in mind, achieves this feat with its thorough performance metrics, effective troubleshooting and extensive reporting abilities.
Key Features:
- Detailed JBoss server monitoring
- Automated troubleshooting scripts
- Comprehensive capacity planning
- Mobile web client and iPhone app
Why do we recommend it?
We recommend ManageEngine Applications Manager for its thorough and detailed monitoring capabilities, especially its ability to automate responses to memory usage issues, which enhances overall efficiency.
It provides instant, detailed visibility into the performance of the JBoss server, monitoring service response time, web applications distributed on the server as well as multiple components. These include Enterprise Java Beans, Java Virtual Machine, Java Database Connection Pools and servlets.
With the aim of reducing repetitive tasks, ManageEngine Applications Manager allows for the automation of restarting the JBoss server if memory usage exceeds set thresholds, through the execution of custom scripts. Alternatively, the use of JMX bean is available to increase the pool size of database connections.
In the case of troubleshooting, ManageEngine Applications Manager monitors both Java heap and non-heap memory, generating a heap dump to ease the identification of potential problems. The automated taking of thread dumps within intervals further assists with the detection and sourcing of problematic code.
With this, the study of the pattern of garbage collection and deadlocked threats are possible, with throughput measured. The fine-tuning of Java performance is also attainable by using the analysis of other JVM parameters.
This opens up customizability options that would not normally be easily accessible through traditional monitoring techniques. With user experience of applications a top priority, the feature to monitor transactions offered by ManageEngine Applications Manager accurately gauges database performance.
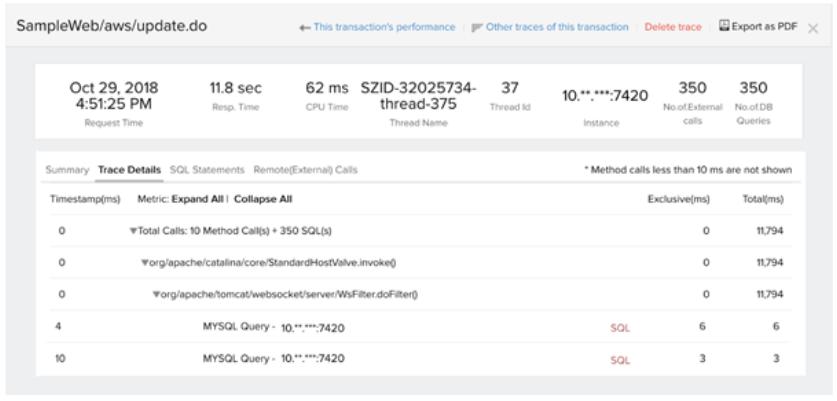
It does this through the tracing of transaction flow and viewing method level metrics, which allows for the fast identification of potential bottleneck issues. Performance metrics of Java transactions are also viewable in detail, from the URL straight down to the SQL query that generated a particular performance issue.
To avoid servers running out of resources, capacity planning is essential. ManageEngine Applications Manager allows you to identify the utilization of resources effectively, specifically those underutilized, to assist in this task.
The monitoring of key performance indicators of the JBoss server, databases further ensures the keeping of file growth, CPU/ disk usage within acceptable range. Its automated, comprehensive and out-of-the-box reports also assist in performing trend analysis, the information gathered within aiding in capacity planning and the prediction/ early identification of bottlenecking.
With the aim of fast, effective corrective action, ManageEngine Applications Manager allows you to keep track of the performance of JBoss servers with its mobile web client and native iPhone app.
This feature lets you troubleshoot and resolve any potential performance issues on the go, without the need to first return to the office first, assuring end-user experience satisfaction.
Who is it recommended for?
It's ideal for businesses that require a versatile monitoring tool offering both on-premise and cloud solutions. Its ease of use and mobile access make it a good fit for administrators who need to manage JBoss servers on the go.
Pros:
- Offers on-premise and cloud deployment options, giving companies more choices for install
- Can highlight interdependencies between applications to map out how performance issues can impact businesses operations
- Offers log monitoring to track metrics like memory usage, disk IO, and cache status, providing a holistic view into your database health
- Can automatically detect databases, server hardware, and devices for real-time asset management
Cons:
- Can take time to fully explore all features and options available
You can download a free 30-day trial at the Link Below!
https://www.manageengine.com/products/applications_manager/monitoring-jboss.html
3. Site24x7 Application Performance Monitor
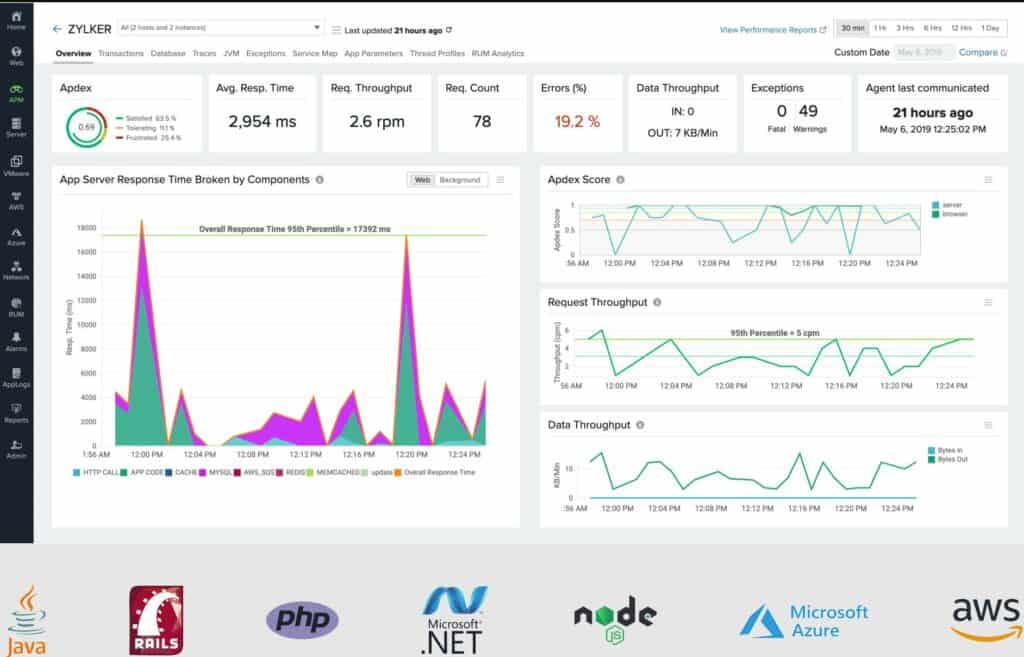
Site24x7 is a cloud-based platform that delivers a range of system monitoring tools. The Site24x7 Application Performance Monitor (APM) includes the ability to examine the code of Java-based programs and link together the operations of different apps.
Key Features:
- Cloud-based monitoring platform
- Detailed Java program tracing
- Real-user monitoring capabilities
- Subscription-based with add-on services
Why do we recommend it?
Site24x7 stands out for its cloud-based, comprehensive monitoring solution. Its ability to trace Java programs in detail and monitor real-user interactions makes it an excellent choice for in-depth analysis.
In the case of the JBoss framework, the APM can identify which Java programs are running over which JBoss services and what other applications and server resources are supporting the process that the Java program and JBoss launch.
As it operates on the cloud, all of the processing power needed to run the monitoring software is included in the price. The service is charged for by subscription, so there are no heavy upfront costs involved in getting started with this monitoring tool.
The system does require that an agent is installed on the server that runs the application. This agent uploads collected stats over an encrypted connection to the Site24x7 server for processing. The system console is also resident in the cloud and can be accessed through any standard Web browser. The screens of the tool can be customized through a drag-and-drop facility.
The APM is able to monitor applications running anywhere, which includes those services that are hosted in the Cloud by AWS, Azure, or serverless systems.
As a piece of Java code executes, the APM watches each process and notes spawned processes and activities. This enables it to follow an application stack that can be used for root cause analysis if performance problems arise.
Activity trace details are shown in the dashboard for the APM. The trail can lead through to the monitoring of other applications, such as a database or a Web server. The APM’s view of all processes running on a server means that it is able to spot background processes that might be coded in Java as well as those that are launched intentionally.
Other services of the Site24x7 APM can enhance the performance tracing function. This is particularly the case with the synthetic transaction monitoring and real-user monitoring utilities built into the APM. Combining the Java monitor in with traces of activities on a website takes your analysis efforts right through to the server’s operating system.
Site24x7 APM is a subscription service that is offered in a base package with a menu of extra services that can be added on. The basic bundle includes credits for testing features and log management transactions. All of the credit levels can be enhanced for a fee. It is also possible to add on a network monitoring service that checks on device statuses and measures network traffic throughput.
Who is it recommended for?
This tool is recommended for organizations looking for a versatile, user-friendly monitoring solution that can handle a variety of tasks, from network monitoring to user behavior analysis, in a single platform.
Pros:
- One of the most holistic monitoring tools available, supporting networks, infrastructure, and real user monitoring in a single platform
- Uses real-time data to discover devices and build charts, network maps, and inventory reports
- Is one of the most user-friendly network monitoring tools available
- User monitoring can help bridge the gap between technical issues, user behavior, and business metrics
- Supports a freeware version for testing
Cons:
- Is a very detailed platform that will require time to fully learn all of its features and options
The base package of Site24x7 is called Pro and it costs $35 per month when paid annually.
You can get a 30-day free trial.
https://www.site24x7.com/application-performance-monitoring.html
4. GroundWork Monitor
A full IT infrastructure monitoring solution, Groundwork monitor combines both open-source and proprietary technologies under a consolidated web services portal. In the aim of delivering high-class network, system, cloud and application monitoring, it provides versatile architecture, allowing for the support of custom reporting and configuration.
Key Features:
- Integrates open-source and proprietary tech
- Customizable dashboards and reporting
- Auto-discovery of network resources
- Hybrid Cloud Monitoring capabilities
Why do we recommend it?
GroundWork Monitor is an effective solution for comprehensive IT infrastructure monitoring, combining a range of technologies into a single platform. Its customizable nature makes it adaptable to various monitoring needs.
Through its use of JBoss Portal Platform 6, which serves as a portal’s Web interface and is an open source, standards-based environment, it allows for the publishing, management and customization of content hosted.
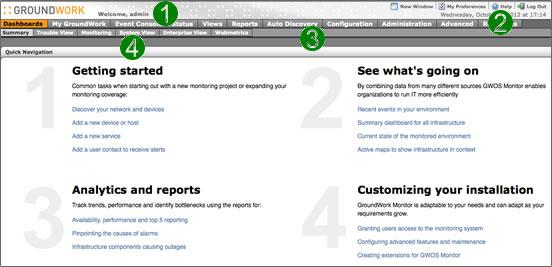
GroundWork Monitor provides both standard and custom dashboards, which administrators can additionally configure to their individual requirements. Dashboards provide a quick, effective and detailed overview of data in real-time, with the option of drilling down into specific sub-applications when required, assisting in the effort of troubleshooting.
Fully scalable, it visualizes all collected data to make interpretation easier, with its NagVis presentation tool. Web performance management is also possible through the dashboard, thanks to the integration of web metrics.
GroundWork Monitor’s auto-discovery feature automatically locates all visible devices on your local subnet, while applying a set of service checks to all devices with correctly set thresholds.
It further adds and co-ordinates network resources with its foundation configuration database, and in the aim of efficient maintenance, allows for the closing of events as well as device, service and externals clean-up.
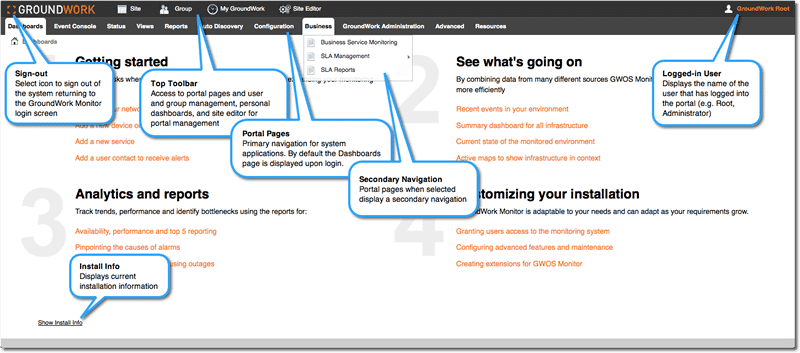
GroundWork Monitor manages host and service groups as well as host downtimes, and the configuration reports available detail contained commands along with all host groups and their services. With the GroundWorks BIRT Report Designer, administrators can further modify, generate and distribute monitoring reports as required.
Some of these include availability, event, performance and status reports, as well as specific insight reports on performance view, notifications, alerts, outages occurred or occurring and SLA management.
GroundWork Monitor employs a sophisticated notification and alerts manager to notify you of issues detected, and its auditing capabilities allow for the tracking of system configuration as well as run time changes in an audit trail.
Its business service monitoring features focus on the monitoring of business groups, processes and applications, while its Hybrid Cloud Monitoring centers on API to API connectors. GroundWork monitor also offers resources to administrators, enabling access to product documentation and as well as a support portal.
This also serves as a useful feature for development environments where new releases need to be monitored for potential impact.
Who is it recommended for?
Recommended for businesses seeking a holistic monitoring solution that covers network, system, cloud, and application monitoring, GroundWork is particularly suitable for those who value customization and scalability in their monitoring tools.
Pros:
- Holistic IT infrastructure monitoring in one platform
- Provides templates as well as customization options for reporting and views
- Visualizes all collected data natively
- Offers a generous trial period longer than most competing products
Cons:
- Interface could use improvement
You can download the GroundWork Monitor Core version here, which while free is limited to 50 nodes and comes without support. You can request a 60 day trial for GroundWork Monitor Enterprise here, which offers 250 nodes and comes with support, or you can request a demo here. For pricing and purchasing of GroundWork Monitor Enterprise, you can contact sales here.
5. Nagios
Nagios provides extensive monitoring of JBoss application servers with the aim of effective implementation of its monitoring capabilities. This leads to the increase of application server, services and application availability as well as the faster identification of issues, allowing administrators to resolve them before they influence performance.
Key Features:
- Extensive JBoss server monitoring
- Flexible alerting options
- Robust API for custom integrations
- Open-source transparency
Why do we recommend it?
Nagios is renowned for its extensive monitoring capabilities and flexibility, especially beneficial for organizations that require a transparent, open-source solution with robust API support.
Nagios actively detects network outages, protocol failures, failed processes or services and batch jobs, alerting you of problems once found and again once fixed. This eases the tracking of overall JBoss application server health and performance.
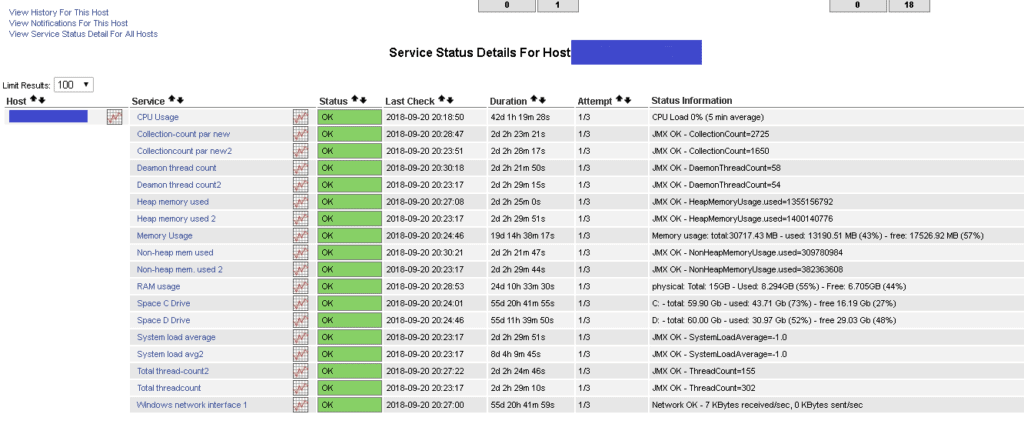
Nagios monitors several attributes of JBoss application servers, including threat status, memory usage and more, and additional plugins, such as the Buzz plugin, further assist in this aspect. This plugin provides a monitoring framework with basic support for JBoss ESB and running in a JBoss application server.
For comprehensive checks of the aspects of the JBoss application server, an in depth checks for JBoss Java EE server plugin combined with the Perl Nagios plugin exists. You can further specify which JMX attributes to check with the Perl Nagios plugin, which uses an uncomplicated protocol to extract information through the MBean archive deployed on the JBoss application server.
Administrators can configure the port MBean opens up for this purpose if required.
Who is it recommended for?
It is ideal for IT professionals and developers who need a flexible, customizable monitoring tool and are comfortable with the technical complexity of an open-source platform.
Pros:
- Open-source transparent tool
- Simple, yet informative interface
- Flexible alerting options support SMS and email
- Robust API backend makes it a great option for developers who want to integrate their own custom applications
Cons:
- Open-source version lacks quality support found in paid products
- Installation can be technical and complex
You can download a fully functional 60 day trial here.
Pricing starts at $1995.00 for the standard edition, which you can view here.
6. eG Enterprise
eG Enterprise is a complete IT infrastructure performance monitor with auto-diagnostic qualities and provides a comprehensive overview of the entire JBoss infrastructure from a single view. It supports extensive visibility into the JBoss application server and all Java applications performance from an intuitive console.
Key Features:
- Comprehensive JBoss infrastructure overview
- Pre-emptive alert system
- Deep diagnostic capabilities
- Code-level issue identification
Why do we recommend it?
eG Enterprise is a complete IT infrastructure performance monitor, notable for its deep diagnostic capabilities and pre-emptive alerts. It excels in identifying and resolving performance issues swiftly.
With the goal of delivering maximum user satisfaction and uptime, EG Enterprise monitors multiple aspects of the JBoss application server with purpose-built monitoring models. These include application code, database connections, slow queries, JVM, web and EJB containers, external service calls and more.
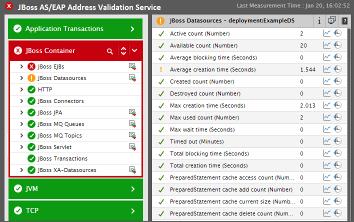
Its pre-emptive system of alerts further assist in immediate notification of issues, allowing administrators to identify and resolve problems before they affect application or system availability. eG Enterprise also supports deep diagnostics for all facets, components of JBoss performance.
These include Java transactions, connections available in the DataSource connection pool, the number of incoming requests by each connector, JMS message queues, as well as EJB thread pool size, JPA and JSP.
eG Enterprise further produces detailed insight through the isolation of business transactions affected by the poor performance of the JBoss application server and catching memory leaks, out-of-memory exceptions in the JVM.
The tracking of the timing for each servlet to execute and the measurement of the execution, creation and invocation, removal metrics for each EJB, combined with other aspects mentioned, vastly improves troubleshooting.
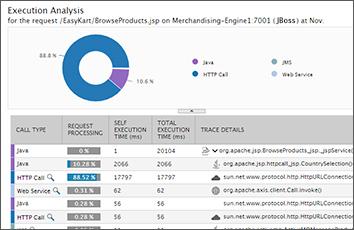
eG Enterprise’s automated system for detecting root causes of performance issues additionally eliminates the concept of finger pointing, and when incorporated with its deep diagnostic capabilities, significantly speeds up the resolving of issues identified. eG Enterprise further advances this task with its ability to identify code level issues.
This allows administrators to drill down into the application code to pinpoint precise causes of slow business transactions and isolate code that is inefficient as well as errors occurring. Java heap memory setting and long-running database queries can also be isolated for this purpose.
Administrators can further optimize code through the isolation of high CPU threads, waiting and root blocker threads in JVM.
Who is it recommended for?
This tool is recommended for larger enterprises or Managed Service Providers (MSPs) that require a thorough monitoring solution capable of detailed performance analysis and root-cause identification.
Pros:
- Can monitor a wide range of virtual host environments, making this truly suited for larger enterprises or MSPs
- Threshold-based altering can notify when VMs go offline or become slow due to resource-related issues
- Offers root-cause analysis to help technicals solves issues faster, resulting in more uptime
Cons:
- No freeware version
You can download a free trial here.
You can view the pricing and licensing options for eG Innovations here, with quotes available on request.
7. Dynatrace
Dynatrace delivers expansive monitoring for JBoss application servers, automatically learning the entire architecture of JBoss in minutes through its artificial intelligence and providing visibility from browsers straight down to individual database statements.
Key Features:
- AI-driven architecture learning
- End-to-end transaction monitoring
- CPU hotspot analysis for JBoss
- Cloud-based, platform-independent
Why do we recommend it?
Dynatrace is highly recommended for its AI-driven capabilities, which rapidly learn and monitor JBoss architectures. Its end-to-end transaction monitoring provides deep insights into performance issues.
This allows Dynatrace to identify dependencies within the JBoss environment and examine availability and performance problems across the whole JBoss application server. Dynatrace further analyzes the database activities of all applications running of JBoss during the process of monitoring, while also tracking JVM metrics as well as custom JMX metrics, amongst others.
Through root cause analysis, Dynatrace conceptualizes the evolution and influence of errors, performance or application issues on user experience. This information assists administrators in the identification of problematic areas potentially affecting users negatively, possibly resulting in loss of revenue or substandard reputation.
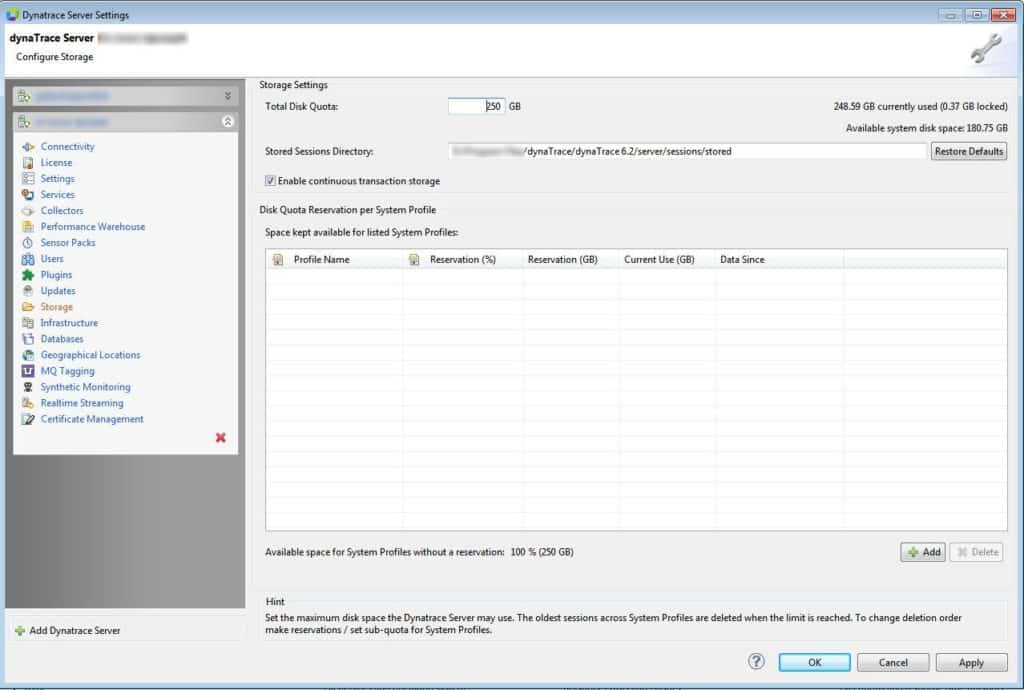
Designed for massive scale, Dynatrace supports all common Java frameworks, and its metric monitoring capabilities expand to include process-specific network metrics, garbage collection metrics, database statements, requests and suspension rate.
This aids in both the preemptive detection and troubleshooting of issues identified. The revelation of the CPU, memory and network health of the JBoss application server, tracked down to the process level, further assists in this task.
Auto-detection starts immediately after deployment, rendering the need for manual configuration unnecessary. With its CPU hotspot analysis for background threads on the JBoss application server, Dynatrace discloses where applications consume the CPU, whether in background threads, other proprietary services or schedulers.
Dynatrace further tracks and interprets all application transactions, end-to-end, while the viewing of the execution of each separate service and service-request type is available.
It also provides administrators with a point of view from a service or service-request type, if they use service flow. Smartscape alternatively reveals the overall environment topology of the JBoss application server.
Who is it recommended for?
Ideal for large networks or enterprises, Dynatrace suits those who need a sophisticated, AI-powered monitoring tool capable of handling complex systems and providing detailed performance analysis.
Pros:
- Highly visual and customizable dashboards, excellent for enterprise NOCs
- Operates in the cloud, allowing it to be platform-independent
- Leverages AI to provide baseline analysis and detect user behavior anomalies
Cons:
- Designed specifically for large networks, smaller organizations may find the product overwhelming
You can download a free 15-day trial here.
For pricing structures or a demo, you can contact Dynatrace here.
8. AppDynamics JBoss Monitoring Tool
AppDynamics aims to bridge application management and business product usage effectively in its monitoring of the JBoss application server and applications. It achieves this through its flawless delivery of traceability and provision of extensive visibility into infrastructure, the performance and the production environment.
Key Features:
- Extensive visibility into JBoss server
- AI-based anomaly detection
- Advanced memory leak tracking
- Free version available
Why do we recommend it?
AppDynamics excels in providing extensive visibility and AI-driven anomaly detection for JBoss servers, making it a powerful tool for detailed monitoring and troubleshooting.
This is crucial for your team’s overall monitoring capabilities where JBoss visibility is critical to the business’s operations. AppDynamics further allows administrators to monitor and identify application code running on JBoss, as well as the execution and accessibility of the JBoss server.
This extends into the monitoring of end-user experience, which provides vital feedback on potential problematic areas. With the ability to monitor performance in real-time, administrators can create better digital experiences for end-users, and the information gathered assists with the instant detection and troubleshooting of issues.
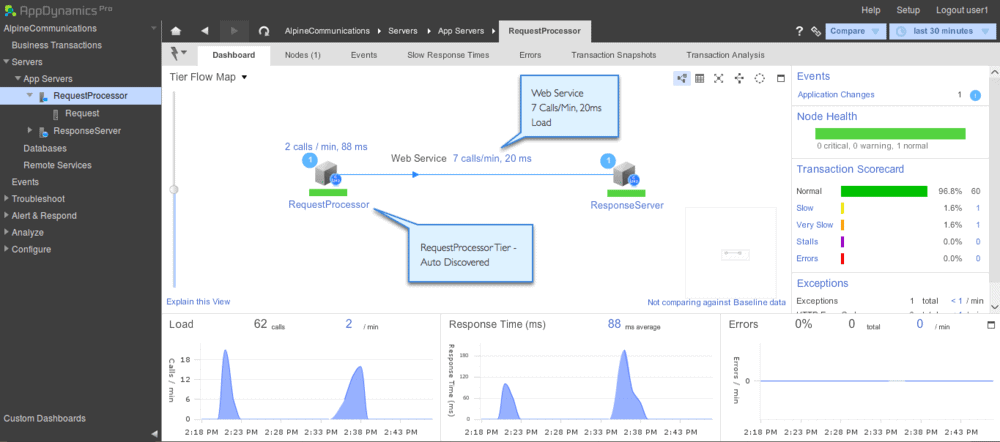
AppDynamics automates the process of discovering business transactions from normal entry points in the JBoss application server and its JVM, while its engine uses machine learning to automatically detect anomalies in these processes.
This, combined with AppDynamics’s deep diagnostic capabilities, allows for the accurate detection of root issues, further aiding administrators in the effective troubleshooting, resolving and diagnosis of potential problems.
With dynamic SLA base-lining and its additional proactive alerting feature, AppDynamics notifies administrators of performance issues before they can cause harm to JBoss application server or application availability.
This equips administrators with the ability to prevent the potential decline of end-user service levels through poor performance. AppDynamics further provides clarity into stack traces, such as user requests failure or timeout and business transactions, through its collection and reporting of each application’s run-time exceptions.
It further monitors memory leaks, tracking them automatically inside the JVM. The detection of the initial causes of these memory leaks requires minimal user analysis and allows administrators to gain visibility into garbage collection. AppDynamics attains this through the utilization of heap usage and critical memory pools over time.
Who is it recommended for?
It is particularly suited for large-scale enterprises that require advanced monitoring capabilities, including dependency mapping, root cause analysis, and real-time performance insights.
Pros:
- Tailored for large-scale enterprise use
- Excellent dependency mapping and visualizations to help troubleshoot complex application systems
- Leverages AI and machine learning to provide root cause analysis and remediation steps
- Includes a free version
Cons:
- Would benefit from a longer 30-day trial period
You can download a free 15-day trial for Appdynamics here or you can schedule a demo here.
You can view packaging structures here, with pricing available on request.
Conclusion
With the constant demand for the availability of the JBoss application server and applications, the successful and continuous monitoring and managing of the JBoss application server is fundamental. Due to its complexity, the underlying need for additional tools and software to monitor JBoss has become essential.
The use of additional tools and software markedly influence the process, aiding in the early detection of potential performance issues and the troubleshooting of problems found. They further ensure availability demands are in line with service-level agreements, ensuring disruptions to end-users are minimal, avoiding financial loss or the degrading of reputation due to downtime.
The different types of software offered and their value to organizations will alter dependent on the size and nature of organizations as well as the costs involved. Hopefully, all of these different products will help to show you what features are available for your specific monitoring requirements. We hope the information gathered here helps in choosing the best solution to suit your particular needs.
JBoss Monitoring Tools FAQs
What are some common JBoss monitoring tools?
Common JBoss monitoring tools include JBoss Operations Network, Zabbix, Nagios, and Datadog.
What types of metrics can be monitored in JBoss?
Metrics that can be monitored in JBoss include server performance, memory usage, thread pool utilization, database connection pool utilization, and application performance metrics.
How does JBoss monitoring work?
JBoss monitoring works by collecting and analyzing metrics from JBoss application servers using a monitoring tool, and presenting the data in a dashboard or report.
Can JBoss monitoring tools integrate with other system management tools?
Yes, many JBoss monitoring tools can integrate with other system management tools such as network performance monitoring, log management, and security information and event management (SIEM) tools.

