IP Sniffers, known as Packet Sniffers, Network Analyzers or Protocol Analyzers, are tools which play an essential role in the monitoring of networks and troubleshooting network-related issues.
Here is our list of the best IP sniffers:
- Site24x7 – EDITOR’S CHOICE This cloud-hosted system scans a network and discovers all devices, recording their assigned IP addresses and recording all details. This package covers wireless and virtual network components as well and can monitor internet connections in WANs. Get a 30-day free trial.
- GlassWire A network scanner that provides real-time network monitoring, visualizes past and present network activity, and detects unauthorized devices. Available in free and paid versions. Runs on Windows.
- Wireshark This free packet analyzer enables users to specify which packets to examine and provides a powerful analysis language. Runs on Windows, macOS, and Linux.
- SolarWinds Network Bandwidth Analyzer Pack This package of two SolarWinds units combines to provide network discovery,m documentation ad mapping plus traffic analysis – all accessing statistics compiled by switches.
- Capsa and Capsa Enterprise Real-time packet capturing, advanced protocol analysis, and comprehensive network monitoring for both wired and wireless networks. Runs on Windows and Windows Server.
- Kismet A free open-source wireless network detector, sniffer, and intrusion detection system. It supports Wi-Fi, Bluetooth, Zigbee, and more. Can be installed on Windows, Linux, and macOS.
- Etherape A free open-source graphical network monitor that visualizes network activity in real-time. It supports various protocols and media, including Ethernet, IP, TCP, and wireless. Runs on Linux.
- Microsoft Network Monitor A free protocol analyzer that captures, views, and analyzes network data. It supports various Windows versions.
Sniffing tools are frequently used by network technicians and administrators, assisting in determining where faults lie such as congested links, applications generating large volumes of traffic, which device/s failed to respond to network requests and the identification of intrusions. IP Sniffers intercept the raw data flowing in a digital network to achieve this and log the data, the analysis of which translates the information collected into a human-readable form.
This enables whoever is using the IP Sniffing software to understand the data and then take the appropriate actions based on the outcomes. The configuration of network switches largely affects what the IP Sniffer is able to detect, allowing it to view traffic on an entire network or limiting it to a particular segment.
Whilst multichannel capture on wireless networks is possible if there are multiple wireless interfaces on the host computer, IP Sniffers on wireless networks are normally limited to one channel at a time. The data assembled can help to further shape traffic through prioritization, limit bandwidth and subnets as well as determine if there is any suspicious network activity from applications taking bandwidth.
These solutions offer individuals, businesses and enterprises the opportunity to monitor, trouble shoot and improve network performance, creating a safe and better workflow across networks. We have selected a few free and paid IP Sniffers for your perusal, detailing their features, capabilities and strengths, with download links and pricing structures listed under each IP Sniffer.
The Best IP Sniffers
1. Site24x7 – FREE TRIAL
Site24x7 serves as a powerful IP sniffer for LAN, WAN, and Wi-Fi networks, allowing IT administrators to capture and analyze network traffic in real time. The platform’s IP sniffing capabilities enable businesses to monitor traffic flows, track IP addresses, and analyze packet-level data across local area networks (LANs), wide area networks (WANs), and wireless networks (Wi-Fi).
This detailed traffic analysis helps identify potential security risks, troubleshoot connectivity issues, and optimize network performance. Site24x7's sniffer is essential for diagnosing network bottlenecks, pinpointing network congestion, and tracking abnormal behavior that could indicate network inefficiencies or security threats.
For LAN networks, Site24x7 provides a detailed breakdown of traffic data, including the number of packets transmitted, data transfer rates, and the IP addresses involved in communication. It also offers insight into traffic distribution, helping to identify areas of high traffic and possible congestion.
For WAN networks, Site24x7 can track traffic between geographically dispersed locations, allowing for centralized monitoring of wide-area connections. This feature is especially useful for businesses with multiple office locations or branch offices, ensuring that WAN links are performing as expected and that remote users are not experiencing delays or disruptions.
In Wi-Fi networks, Site24x7’s IP sniffer helps monitor the performance and health of wireless connections. By capturing traffic between Wi-Fi access points and connected devices, administrators can identify issues like weak signals, interference, or unauthorized devices consuming excessive bandwidth.
Deep visibility into wireless network traffic makes it easier to troubleshoot common Wi-Fi problems such as slow speeds, dropouts, or connectivity failures, ensuring that users experience a stable and reliable wireless connection.
Along with its IP sniffing features, Site24x7 offers a comprehensive set of troubleshooting tools that enhance its effectiveness. The platform includes real-time alerts for issues like latency, packet loss, and bandwidth usage spikes. These on-demand tools enable IT teams to take immediate action.
Site24x7 provides historical traffic analysis and performance metrics, helping administrators track long-term network trends and pinpoint recurring issues. These troubleshooting features, combined with its robust IP sniffing capabilities, make Site24x7 an invaluable tool for managing and maintaining the health of both wired and wireless networks.
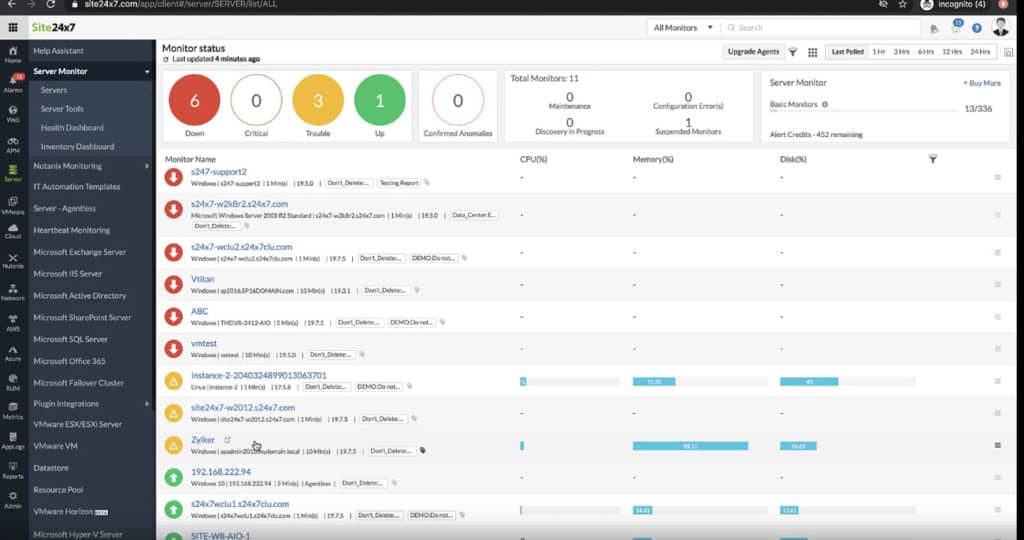
The full Site24x7 platform also provides constant automated monitoring for network devices and servers. The tool scans the network and documents every piece of equipment that it discovers. The system also draws up a network topology map. Other services in the package include cloud platform monitoring and a range of facilities for monitoring and testing Web applications and websites.
Pros:
- Detailed insights into network traffic across LAN, WAN, and Wi-Fi
- Captures and analyzes traffic in real time
- Deep visibility into packet-level data, including IP addresses, bandwidth consumption, and communication patterns
- Helps identify common Wi-Fi issues such as weak signals, interference, or unauthorized devices
- Troubleshooting features like real-time alerts, historical analysis, and performance metrics
Cons:
- Some of the advanced features require skills and training to use
You get a Network Configuration Manager and a Log Manager in with all plans. There are many other features in each Site24x7 edition. The best way to explore the platform is to access the 30-day free trial.
EDITOR'S CHOICE
Site24x7 is our top pick as an IP sniffer for LAN, WAN, WiFi and for network troubleshooting because it offers a comprehensive suite of features tailored to meet the diverse needs of modern network environments. Its ability to provide real-time monitoring and detailed analytics for various network types, including LAN, WAN, and WiFi, makes it an indispensable tool for IT professionals. Site24x7's well-planned console simplifies the process of sniffing and analyzing IP traffic, ensuring that even less experienced users can quickly gain insights into network performance and security. The platform's extensive alerting capabilities ensure that any potential issues are promptly identified and addressed, minimizing downtime and maintaining optimal network performance. Furthermore, Site24x7's robust reporting features allow users to generate detailed reports, making it easier to identify trends and make informed decisions. The integration with other tools and services within the Site24x7 ecosystem enhances its utility, providing a unified view of the entire network infrastructure. The flexibility and scalability of Site24x7 make it suitable for businesses of all sizes, from small enterprises to large corporations, ensuring that network administrators can maintain control over their networks with ease and confidence. Overall, Site24x7 stands out as a reliable and efficient solution for comprehensive network monitoring and troubleshooting.
Download: Access 30-day FREE Trial
Official Site: https://www.site24x7.com/signup.html?pack=44&l=en
OS: Cloud-based
2. GlassWire
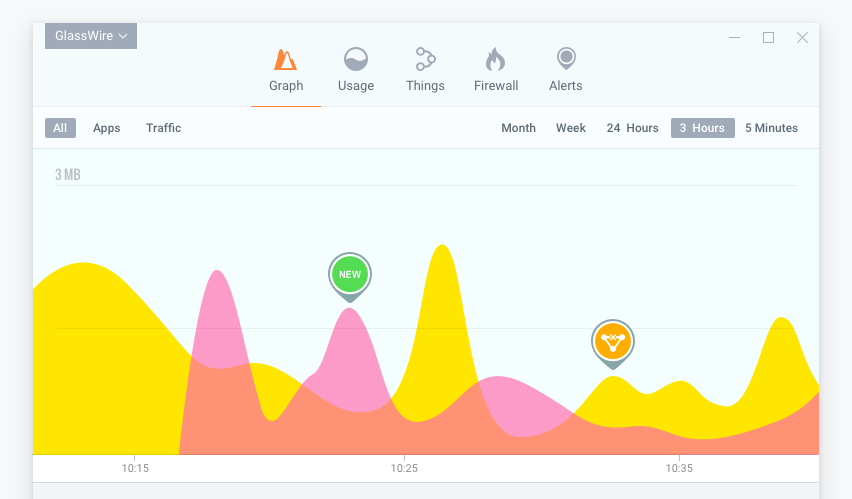
GlassWire’s interface is designed for easy access and an overall visual viewing perspective of all network activity. All past and current activity, incoming and outgoing bandwidth is shown on the graph, whilst clicking on it will provide details on the applications initiating the bandwidth use.
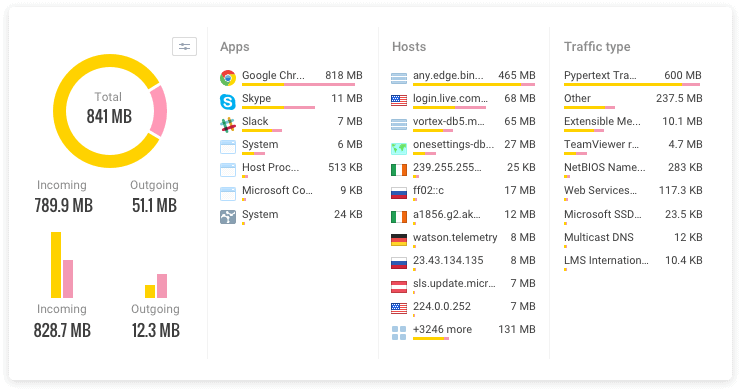
GlassWire can further breakdown all network activity into applications and traffic types, detailing the hosts of all applications communicated with and their country of origin while automatically resolving the hosts. Easy use of sliders allows you to analyze all bandwidth activity under daily, weekly and monthly headings. This is especially useful if you are trying to identify patterns on your network as date and time trends can reveal a lot about potential issues on your network.
GlassWire alerts you instantly if anything new accesses the network from your computer and if your server or computer communicates with a known domain/ IP threat. It will also alert you if new Wi-Fi hardware with your network name appears close by and if your Wi-Fi network loses its password.
Its discreet alert system aims to not interrupt workflow or servers, allowing you to go to the GlassWire alerts tab to view in detail at a later time. This means that you can come back to the alerts when it is convenient for you and your team.
GlassWire also boasts a toolbox of network security checks with the intention of adding more intrusion detection rules to its current arsenal. This includes detection of system file, device list and application information changes as well as APR spoofing monitoring.
This makes the application a useful tool when trying to combat a whole host of cyber security events that have the potential to cause issues on your network. A point to consider is that GlassWire will not track the total bandwidth usage on your entire network.
It only tracks the bandwidth for the server and computer it is installed on. However, if you need to monitor remote servers, you can easily monitor their network activity using GlassWire’s remote access feature from your local computer.
Flexibility is an important part of your network monitoring solution, and GlassWire offers you just that. GlassWire’s Remote Desktop Protocol or RDP connections provides full remote access control to your PC or the server, working in the same fashion on a remote server as it would on your local computer.
The connection allows viewing in real time and an alert will be sent every time an RDP connection occurs. This helps you to administer issues without having to leave your desk, especially if the server that you wish to monitor is sitting in a remote location such as a server room or data center.
GlassWire will also monitor when your computer idles or is in use, keeping track of major network activity whilst it is unattended, to identify it as normal or abnormal, allowing you to act on any suspicious activity.
Pros:
- Wonderful interface – can easily see key metrics and current status
- Provides a granular view of each type of traffic, source, and destination
- Offers a variety of alerting functions
- Includes remote access functionality
Cons:
- Doesn’t track total bandwidth usage across the entire network
GlassWire is compatible with Windows 7, 8, 10 and android devices. A free version can be downloaded here. Pricing starts at $39.00 for the basic version of GlassWire.
3. Wireshark – (Best Free Version)
Wireshark is a name that needs very little introduction in IT circles. It is a network protocol analyzer that analyzes your network at microscopic levels, deep within the packets of your network’s data. Most importantly, it could be thought of as a standard networking utility that is found amongst both non-profit and commercial enterprises, educational institutions and government agencies.
Its continuous development thrives due to the volunteering and contribution of networking experts across the world. This makes it a very handy tool to have at your disposal, especially if you need to understand the inner workings of an application, and how it is communicating on your network.
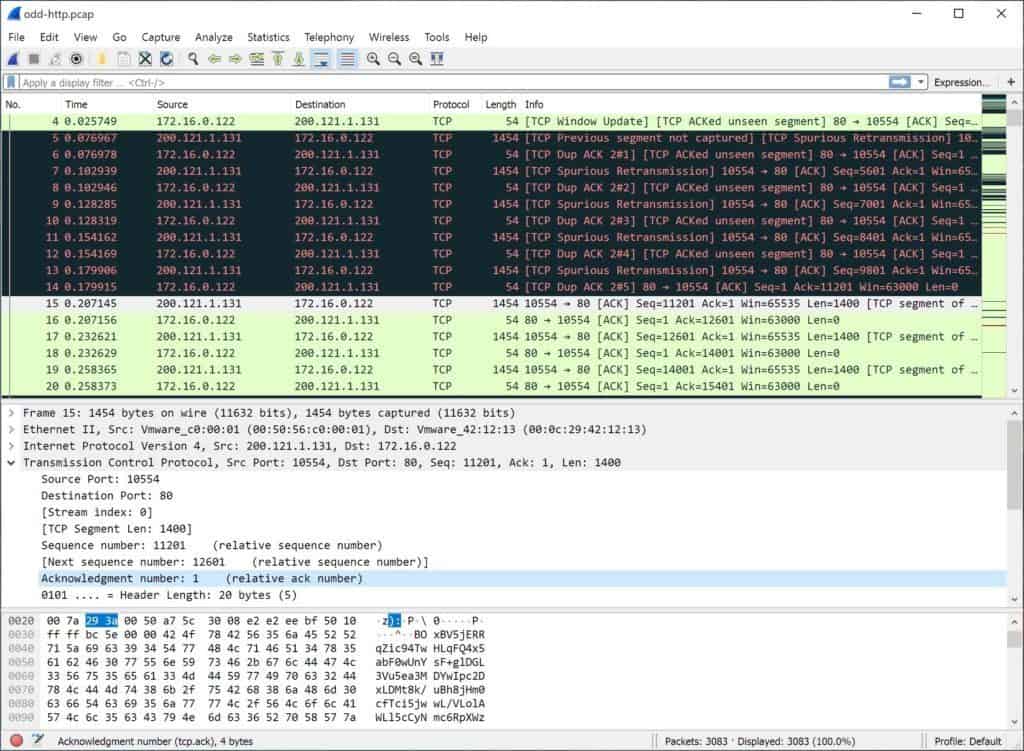
Wireshark balances raw data with visual representations, aiming for portability, compatibility and simplicity. Previously known as Etheral, Wireshark not only captures data, it provides advanced analysis tools. If the server you are using has a desktop installed, Wireshark can collect and analyze the data on the spot.
If not, you will have to capture the data remotely by targeting that specific host to generate a dump of those network transactions and the traffic that they generate. The resulting pcap file will then have to be pulled into Wireshark and analyzed that way. On launch of Wireshark, you can either start capturing data immediately, with the option of specifying filters on data collected, or load an existing pcap file.
Without specifications on filters, Wireshark will automatically collect all network data observed by your selected interface. This is a lot of data, and can be useful for general analysis in some instances. Apart from deep inspection of protocols, Wireshark also offers live capture, offline analysis as well as powerful display filters and rich VoIP analysis.
You can view your captured data via the GUI or TShark utility. For ease of use, coloring rules can also be applied to the packet list for quick inspection and identification. This is a real time saving feature for those extra in-depth traffic analysis jobs.
Its multi-platform capabilities make it compatible with Windows, Linux, macOS, Solaris, FreeBSD, NetBSD, and several others as well. This makes it one of the most versatile packet capturers on the internet. The best part? Its free to download and use.
Pros:
- Massive open-source community keeps the software updated and new features added periodically
- Built by network professionals, for network professionals
- Can save captured packet data for further analysis or archival purposes
Cons:
- A steeper learning curve, even for those who use IT products regularly
- Pulls all data over the network unless intentionally filtered out
Wireshark can be downloaded here.
4. SolarWinds Network Bandwidth Analyzer Pack
This software pack contains the Network Performance Monitor and its counterpart, the Network Analyzer, which work together to provide an effective monitoring and analysis solution. SolarWinds is well known for their excellent monitoring tools and applications which can be found in many network operations and data centers.
The Network Performance Monitor monitors transmission speeds, rates and the reliability of packet transmissions to indicate network performance. It comprehensively monitors faults, which leads to the reduction of network outages, with quick detection and diagnosing of performance issues on multi-vendor networks.
By being able to preemptively deal with potential issues you can save you and your company a lot of time, money and effort.
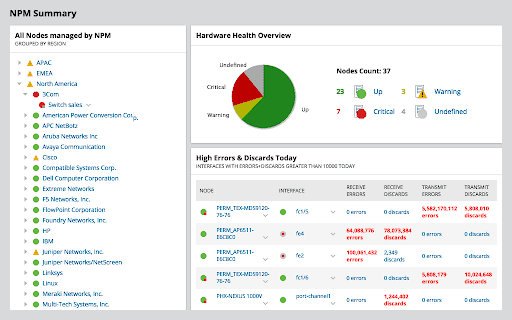
Irregularities and anomalies are very easy to spot thanks to the variety of charts and visual aids presenting the obtained data. Identification of root causes can be sped up by dragging and dropping the metrics of network performance on a single timeline, allowing you to visually correlate all your data.
If you are part of an incident response team then this feature will be especially useful during the post operation phase of your investigations. SolarWinds Network Performance Monitor also allows you to create your own alerts based on nested trigger conditions, simple or complex, as well as defined parent/ child dependencies and network topology.
This is great for custom applications that your company might be running that have no monitoring of their own. This makes SolarWinds Network Performance Monitor an especially useful in development environments.
The Network Analyzer, however, focuses on the network at a closer level, ferreting out anomalies and bandwidth hogs, sorting the data by merit of applications, protocols or users. Alerts are sent out when unusual traffic patterns are detected, including the decrease, increase or sudden disappearance of traffic.
Additional notifications can also be created for devices that stop sending flow data. This makes it an ideal monitoring solution for complex environments that require immediate action if a drop in communication occurs.
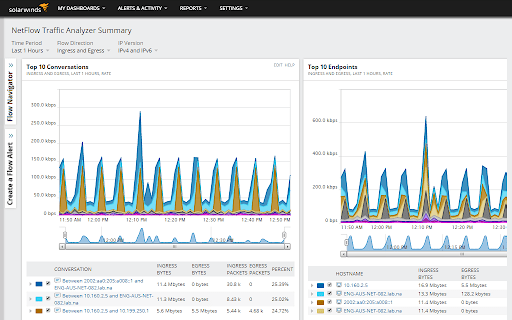
The patterns of traffic data is presented in a web-based interface, correlating the data into an effective and understandable format for monitoring and reviewing all traffic. Root causes can be identified easily by dragging and dropping the metrics of network performance and NetFlow analytics on a single timeline, visually correlating all your data.
This makes it much easier for your monitoring staff to detect sudden changes so that corrective action can be taken.
Pros:
- Great interface that balances visualizations and key insights well
- Highly customizable reports, dashboards, and monitoring tools
- Uses simple QoS rules for quick traffic shaping
- Built with large networks in mind, can scale to 50,000 flows
- Available for both Linux and Windows
Cons:
- Is a highly specialized suite of tools designed for network professionals, not designed for non-technical users
SolarWinds Network Bandwidth Analyzer Pack is compatible with Windows environments only. A free 30-day trial version of this is available for download here.
5. Capsa and Capsa Enterprise
Capsa is a network analyzer freeware for troubleshooting, monitoring and analysis of networks and comes in two versions. The free version of is aimed at students, teachers and those interested in learning about protocols and networking technology.
It is a good starting point for users that are not necessarily proficient in technical analysis but would like to experiment with the platform. The level of detail that this application is capable of is very high, making it viable as an actual commercial tool that can be useful in production environments.
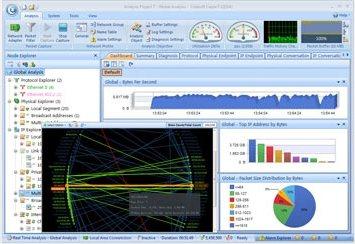
While limited to monitoring 10 IP addresses altogether, it does capture packets and offers some graphical analysis of data collected. Its unique dashboard is designed to assist novice system administrators in identifying network issues, regardless of their level of knowledge or experience in packet knowledge.
This version of Capsa is capable of monitoring over 300 protocols, it both monitors and saves email content, while also supporting triggers. These can be used as alerts, set for certain situations, enabling Capsa to be used to an extent in a support capacity.
Capsa Enterprise is the paid version of Capsa and is aimed at small businesses and enterprises and mission critical environments that need high performance monitoring and alerting solutions. It provides monitoring, troubleshooting and analyses of wired and wireless networks and captures packets in real-time.
It saves all data transmitting over local networks while its advanced protocol analysis supports over 1800 protocols. This includes sub-protocols, network applications based on protocol analysis and VoIP.
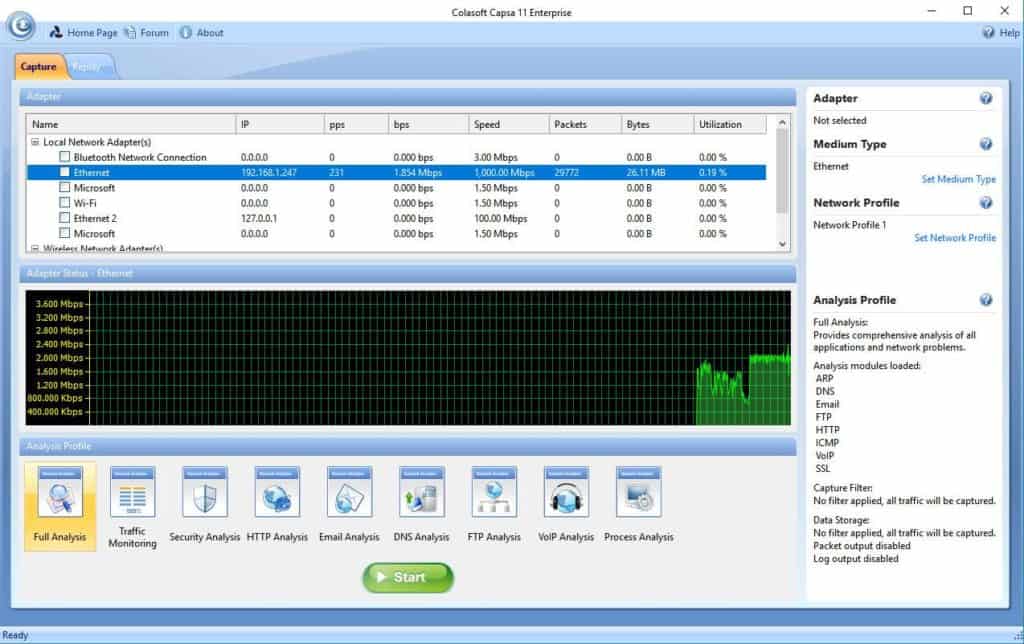
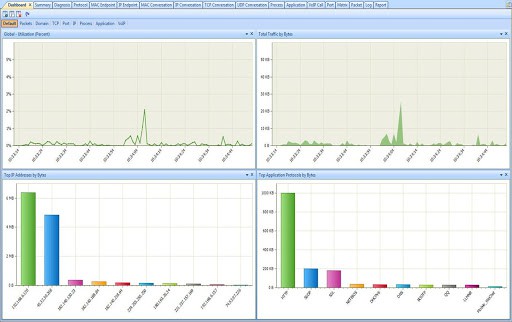
Caspa Enterprise supports multiple network behavior monitoring, including the viewing and storage of emails and instant messaging, enabling the ability to monitor for any security or data handling violations within small businesses and enterprises. Its overview dashboard is designed to be user friendly which allows for quick review and interpretation of network statistics, data retrieved.
Its effective detection and diagnosis of suspicious hosts assists in pinpointing network problems timeously. Its extensive statistics related to each host on the network also helps to identify the specific traffic that passes through each host through the mapping of the traffic, IP addresses and MAC of all hosts on the network.
Capsa is only available for Windows Server 2008/ Server 2012/ Vista/ 7/ 8/ 8.1 and 10
Pros:
- Supports over 1800 protocols for monitoring
- Offers analysis for VoIP performance problems
- Insights automatically highlight potential attacks and abnormalities
Cons:
- The interface can feel cluttered, especially when monitoring larger networks
You can download the free version of Capsa here. You can download a free trial of Capsa Enterprise here. Pricing for Capsa Enterprise starts at $995.00
6. Kismet
Kismet offers a wide range of functions, being a wireless network and device detector, a sniffer, a wardriving tool as well as wireless intrusion detection framework. This gives kismet the ability to analyze traffic from both hidden networks and un-broadcasted SSIDs.
This tool can be invaluable when you cannot source the cause of an issue, particularly in the cases of rogue networks or access points incorrectly set up. Kismet has been around for a very long time and is a tried and trusted tool for seasoned professionals.
It lacks a GUI, which makes it challenging for new users, but it is a powerful and effective application for those that know how to navigate through its many options.
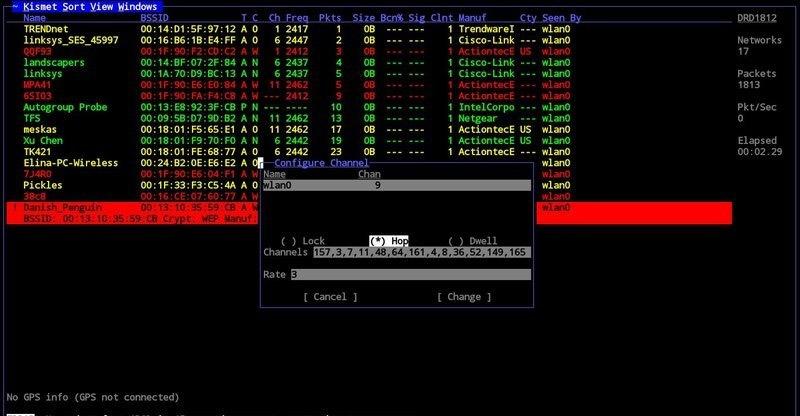
This tool is highly effective for a wireless- heavy network, where there is a lot of wireless traffic and devices connected. Some software defined radio hardware (SDR), Bluetooth and Wi-Fi interfaces as well as other special capture hardware is supported.
If you have unexpected issues on your wireless network then this is an excellent tool to use in your investigations because of the way that it isolates the network data and gives you clear and simple information about the detected elements.
Linux is the intended operating system that Kismet functions under, but there are exceptions as seen below. Providing your operating system is under the WSL framework, Kismet supports Windows 10 (to a point), Linux and OSX.
Bluetooth devices, Wi-Fi cards and other hardware on Linux are mostly supported. OSX supports built in Wi-Fi interfaces, while it will work on Windows 10 with remote captures.
Pros:
- Available for Linux, Mac, and OpenBSD
- Can scan for Bluetooth signals along with other wireless protocols outside of Wifi
- Allows for real-time packet capture that can be forwarded to multiple team members
- Uses plugins for additional features keeps the base installation lightweight
- Free to use
Cons:
- Designed for smaller networks
- Lacks enterprise-level reporting capabilities
- Reliant upon the open-source community for support and updates
You can download Kismet here.
7. Etherape
Etherape, modeled after Etherman, is a free, open-source network monitor for UNIX with similar functions to Wireshark. The main difference between the software is the presentation of data.
Etherape provides a more graphic and visual oriented viewing of data, whilst Wireshark’s interface allows for comparison of network performance in a more numeric, linear fashion.
This feature of Etherape makes it a better choice for those who are more visually and graphically inclined. Sometimes a visualization can really help to understand connectivity issues instead of just strings of data.
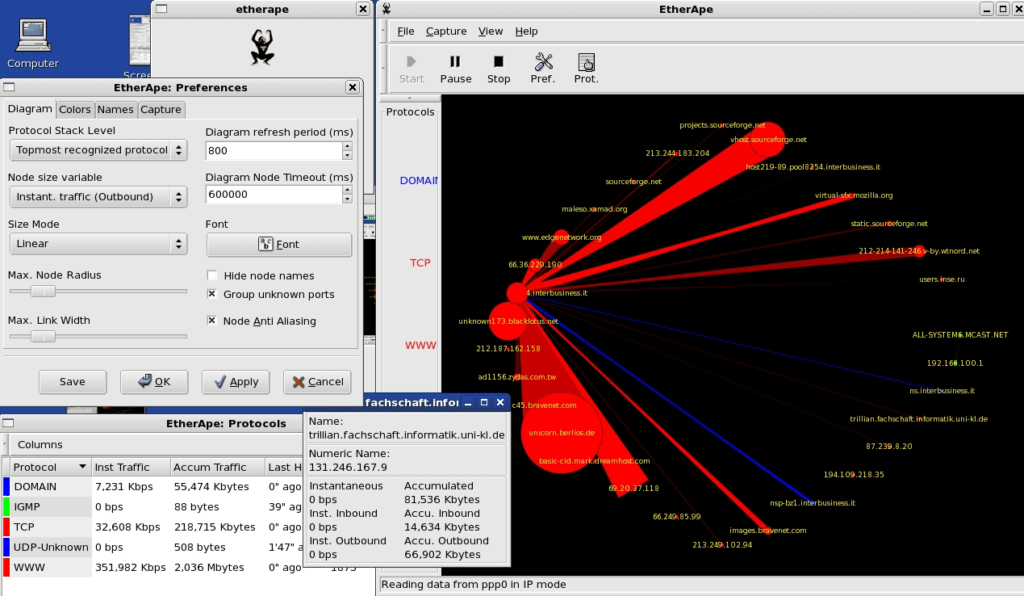
Etherape’s display of hosts and links adjust according to the amount of traffic flow in the network, with nodes seeing higher volumes of activity shown as larger in its representation.
Color is also used on nodes and links for the easy identification of the protocol most used. For detailed information on data collected, click on the node or link which will in turn open a dialog for viewing of breakdowns and statistics on traffic.
This is an effective way of illustrating issues without needing to dig into system and network logs as it is all displayed in one central location. A network filter using pcap syntax can refine data display and, for convenience, there is an option of centering single nodes on the display.
Users can also create an inner circle of user chosen nodes with other nodes around. Etherape also offers TCP and IP modes as well as a link layer and you can view network traffic within your network, using either IP to IP or port to port TCP. Etherape has the ability of live viewing of captured data, with the option of also reading packets from a tcpdump capture file.
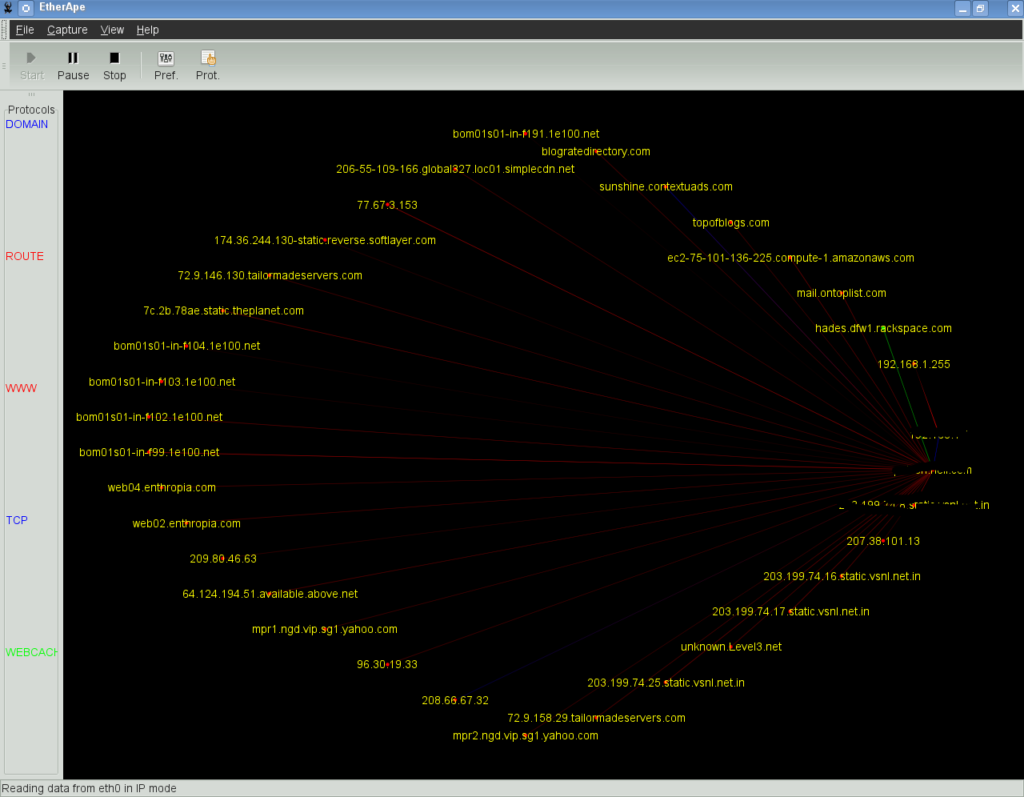
Ethernet, FDDI, ISDN, PPP, SLIP, Token Ring and other WLAN devices are supported by Etherape, including certain encapsulation formats. An important note to consider, supporting packages such as libpcap packet library, GTK+ and GTK Builder (Version 3.0 or above) and the standard resolver library (name varies with operating system and distribution) are required to be installed on your system before you can download Etherape.
Etherape is compatible with OSX and NIX environments.
Pros:
- Completely free
- Continuously updated
- Leverages simple but powerful data visualization to display information natively
- An open-source project
Cons:
- Only available for Linux, Unix, and MacOS
You can download Etherape here and information on supporting packages can be found here.
8. Microsoft Network Monitor
Microsoft Network Monitor is a freeware network IP Sniffer, with a dedicated support site, and is aimed at both beginners learning how to analyze network data as well as veteran network administrators. Ideal for analyzing network traffic both at home and in organizations, it views and displays network traffic in real time on an easy, usable user interface.
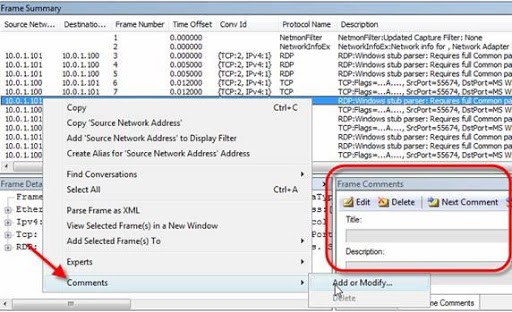
Microsoft Network Monitor allows for process tracking and gives users the option to group network conversations, with support for over 300 Microsoft propriety and public protocols. It also provides a mode for wireless monitoring, which wireless NICs support, and lets you capture wireless network packets.
Sessions can be captured simultaneously which enables faster capture and viewing of network data, easing the process of analyzing and troubleshooting problems with the network as well as applications within the network, with the added benefit of being able to reassemble fragmented data.
Libpcap capture files can be read by Microsoft Network Monitor and there is an API to access the capture and parsing engine.
It is compatible with Windows.
Pros:
- Can capture multiple sessions at once
- Features a simple lightweight graphical interface
- Extensive API support for long-term data capture
Cons:
- Might be barebones for companies looking for a wider range of monitoring options
You can download Microsoft Network Monitor here.
Conclusion
As shown in the breakdown of IP Sniffers here, there are a variety of solutions available for the monitoring of networks and troubleshooting network-related issues. All of these applications have a place where one would be more suitable than the other as each has features specializing in different areas.
The main take away from all of this is that they all have the same objective with the aim of improving performance and creating secure networks without hassles and complications. You can learn a lot about your environment by employing these kinds of applications, which ultimately helps you and the organization to create a more secure network in which to operate.
Depending on your intentions, experience, the size/ nature of your business or enterprise, there is an IP Sniffer designed to suit your needs as well as your budget. Not all solutions are created equally, and your requirements will be as unique as your network’s layout, and your requirements.
There is a solution out there just for you, whether it be a paid one or a free one. We hope the information supplied here helps you make your decision when trying to find your specific requirements against both free and paid IP Sniffers.
IP Sniffers FAQs
What types of traffic can an IP sniffer intercept?
An IP sniffer can intercept a wide range of network traffic, including web traffic, email traffic, VoIP traffic, and video traffic, among others.
How do IP sniffers work?
IP sniffers work by capturing packets of data as they travel across a network, and then analyzing the packets to extract information about the source and destination IP addresses, as well as other details about the packets.
What are some use cases for IP sniffers?
IP sniffers can be used for a variety of purposes, including network troubleshooting, network monitoring, and network security analysis.
What are some popular IP sniffer tools?
Some popular IP sniffer tools include Wireshark, tcpdump, and Microsoft Network Monitor.
What types of information can be obtained from network traffic using an IP sniffer?
Using an IP sniffer, you can obtain information about the source and destination IP addresses, the protocols being used, the content of the data being transmitted, and the timing and volume of the traffic, among other details.
What are some best practices for using an IP sniffer?
Some best practices for using an IP sniffer include understanding the network topology and protocols being used, setting realistic filtering and capturing rules, and verifying the results with other network monitoring tools. It is also important to ensure that the captured traffic does not violate any privacy or security policies.

