Staying on top of your systems and networks is a big challenge and can take up considerable time and resources for your organization. Nevertheless, monitoring these systems is critical for an organization's continued operations.
Many companies have built observability platforms that automate the monitoring process to ease this all-important process, so no human intervention is required. At the same time, these platforms gather metrics at regular intervals to assess the health and performance of these devices. Many of them even send alerts when a metric goes above or beyond an established threshold.
One such monitoring platform that we will talk about in this guide is Instana.
What is Instana?

Instana is an Application Performance Management (APM) Software that automates the monitoring and maintenance of applications. It focuses significantly on microservices and cloud-native applications. These are some of the most demanding applications to monitor because they rely on many factors built on complex technologies like containers.
Instana gathers metrics across different points in your infrastructure, so you can put them together quickly to get a perspective of the problem and its root cause. Accordingly, you can fix the problem as soon as possible.
Features of Instana
Here is a detailed look at some of the essential features of Instana.
- Automatic Discovery Instana uses an advanced discovery approach as microservice applications that consist of hundreds or thousands of constantly-evolving building blocks. It identifies and maps each of these components and their dependencies to give you a comprehensive understanding of the status and performance of each of these components. Each newly discovered component is linked with other existing components to provide a comprehensive understanding of its role in the organization's infrastructure.
- Comprehensive Instana monitors a wide range of physical, logical, and business components. Some physical components include data centers, clusters, Kubernetes, containers, and hosts, while the logical components include calls, traces, services, and endpoints. Lastly, the business components include business processes and services. Essentially, it covers most aspects of any infrastructure.
- Integrations A highlight of Instana is its extensibility. This tool integrates well with all popular cloud infrastructure platforms like AWS, Azure, GCP, IBM Cloud, etc., tracing tools such as GraphQL, AWS Lambda, Scala, etc., alerting and notification tools like Google Chat, Microsoft Teams, Webex Teams, and more, CI/CD tools like Jenkins and Mina, logging tools like Splunk, ELK, etc., and agent sensors such as Hadoop YARN, Kafka, MongoDB, and more. Besides these extensive integrations, it also has a web and agent REST API for integrating it with your custom applications.
- Uses Agents and Sensors Instana uses agents and sensors to monitor different aspects of an object. Typically, sensors are mini-agents that monitor only one aspect, and a single agent controls all the sensors for a device. In general, there is only one agent per device. For example, one sensor can monitor the CPU's temperature while another can monitor the memory use of the same device. One agent controls all these sensors. Since these agents and sensors are continuous and automatic, you can understand the device's health and change its hardware as needed.
- Quick Instana uses advanced streaming technology to process millions of events every second in real-time. As a result, it takes an average of three seconds to process an event and display the same to the user.
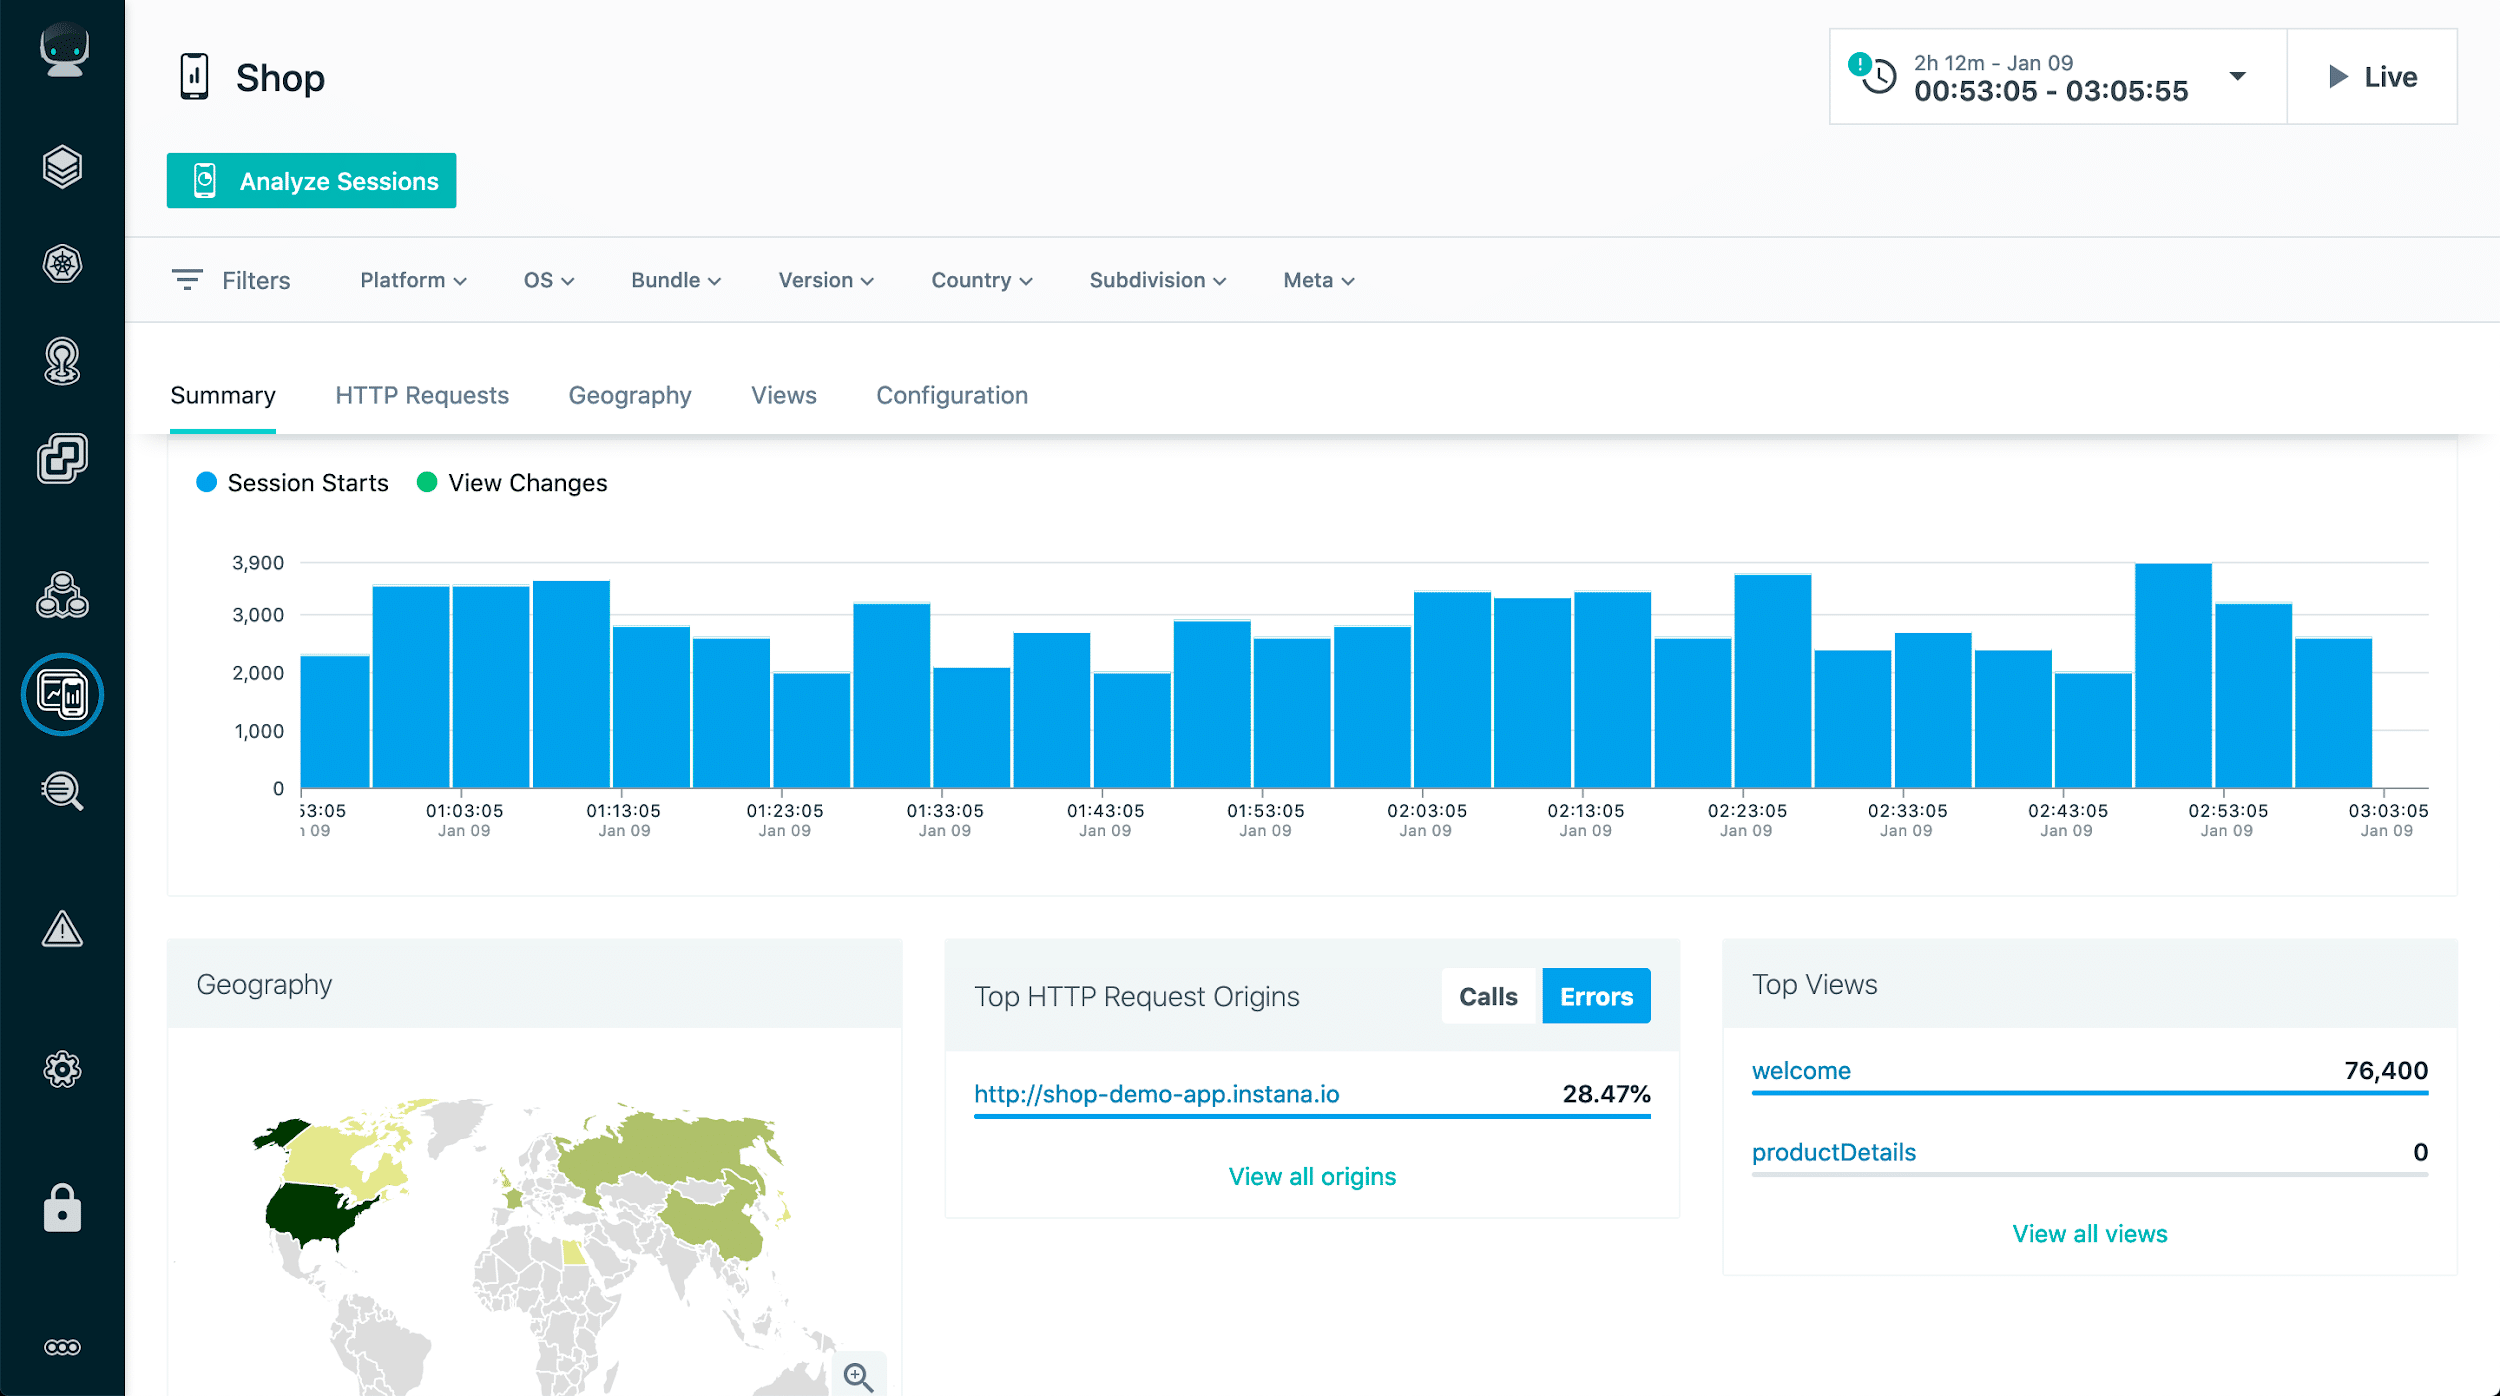
- Provides a Visual Representation Instana uses dynamic graphs to represent the collected information to get a contextual view of the state of your infrastructure. This contextual information will also come in handy for resolving issues. These graphs also come with upstream/downstream buttons, and when you click them, you can navigate to the dependencies that feed data to a particular device (upstream) or devices that take data from the device (downstream). This will help to avoid dependency issues that can break later.
- Offers Application Perspectives Application perspectives give a customized view of your applications and their performance. Based on your specific needs, it captures the semantic and information you need to optimize your applications.
- Detailed Analytics Detailed analytics is another area where Instana scores over its competitors. It collates unsampled and high-cardinality data to generate new insights that can improve decision-making in your organization. Instana also comes with advanced features such as tag-based filtering, visualization, data grouping, and extensive tags – all without having to code a single line! All these come out of the box when you start using Instana. The most significant advantage is that it collates data from different sources and connects them to give a fresh perspective of your organization's operations.
- Helps with Root Cause Analysis In general, root cause analysis consists of two steps. Firstly, the issue has to be fixed, and secondly, the team has to ensure that the underlying cause is resolved so the problem doesn't recur. Instana helps with these steps, thereby making life easier for DevOps teams. Thus, these are some of the salient features of Instana, and undoubtedly, it shows that Instana is a reliable platform for collecting metrics and making sense from them. Next, let's do a quick critical review of this platform, analyzing the pros and cons.
A Critical Review of Instana
Instana comes with many cool features to help your organization leverage your device's metrics.
Also, its integration with almost every off-the-shelf and custom app makes it a convenient platform for organizations. Its tracing feature, application perspective, stack traces, and excellent customer support are other reasons to use this tool.
That said, Instana can also be better in some areas. In particular, it can have a broader range of visual charts types and a better query tool to search through the tons of data generated by devices. Detailed documentation and training videos will also come in handy, especially for those who don't have much experience with such observability platforms.
So, if one or more of the above aspects are important for you, check out the alternatives listed below.
Instana Alternatives
Here's a look at some of Instana's alternatives:
- SolarWinds Server & Application Monitor – FREE TRIAL Coming from a company renowned for its monitoring capabilities, the SolarWinds Server & Application Monitor provides complete control over the availability and performance of different resources within your organization. It helps with capacity planning and bug fixing as well. You could give Server & Application Monitor a try on a fully functional 30-day free trial.
- Datadog An advanced monitoring solution well known for its high usability and reliability. Its easy installation, appealing dashboards, and relevant alerts provide good returns on your investment, besides allowing you to make good sense of the data collected by its agents and sensors.
- NewRelic One This is a data analytics tool that provides visualizations in real-time, so you can quickly understand the state and performance of your devices at any time. Such visualizations help with proactive monitoring to ensure that your end-users are not impacted in any way.
- AppDynamics This powerful monitoring tool provides a comprehensive picture of your devices' performance. You can also drill down to the specific metrics to understand which areas must be improved.
- Dynatrace A salient aspect of Dynatrace is its integrating AI into the tool. As a result, it gives accurate information to users so that you can take appropriate actions accordingly. A vibrant community also backs it.


