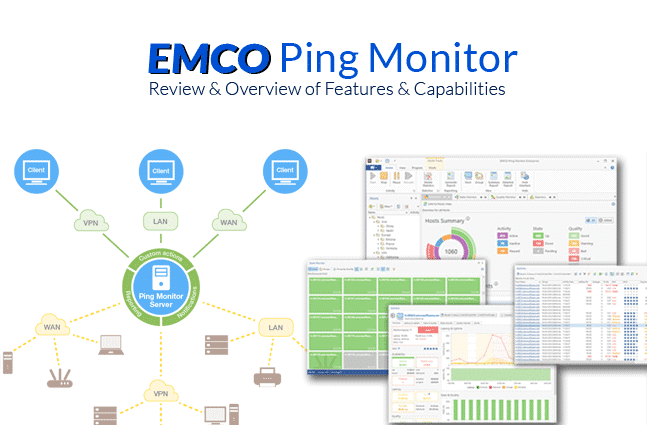
EMCO Ping Monitor is tool is an awesome software package that gives you the ability to monitor your servers, computers and networked devices via ICMP easily and quickly.
For being such a well-rounded tool, the price tag is quite low for the amount of functionality you get out of this tool.
Lets jump into a full breakdown and review of EMCO Ping Monitor to see why we're so pleased with the price to capabilities that it has to offer and how it can potentially save your business from disaster!
To follow along with our review, here's the link to download the software and get it installed:
https://emcosoftware.com/ping-monitor
EMCO Ping Monitor Review
Some topics we're going to review are as follows:
- Installation & Monitoring Protocols
- Web User Interface & Controls
- Hosts Management
- Notifications, Reports & Event logging
As you can see, we have a lot to cover, so let's jump right into this review of EMCO Ping Monitor to get a glimpse into what it can do for you, alternatively check out the best pinging program options available.
Installation & Monitoring Protocols
Installation of this software is fairly straight forward and any admin can get this installed within minutes.
There are some basic system requirements that should be met in order to run the software correctly and efficiently, especially if you are setting up the enterprise version, which we'll mainly be covering in this review.
System Requirements
In order to run EMCO Ping Monitor, you'll need to meet or exceed the requirements below.
Minimum Hardware Requirements
- Intel Core Processor or Equivalent
- 4GB Ram
- 2GB Hard disk space
Recommended Hardware Requirements
- Intel Core Processor or Equivalent (6th Gen or Newer)
- 8GB or More of RAM
- 10GB of Free Disk Space
Supported Operating Systems
- Windows Vista, 7 (sp1 or later), 8, 8.1 or 10
- Windows Server 2008 (sp2 or Later), 2008 R2 (sp1 or Later), 2012, 2012 R2, 2016 or 2019
- Local Administrative Rights on the OS/System
- Microsoft .NET Framework 4.5.2 or Above Installed
- Ports 48017 – 48018 TCP Open on Firewall
Adding Hosts or Networks
There are several options for adding hosts to EMCO software:
- Add a Single Host
- Add Multiple Hosts by IP Range (this option gives you the ability to add your local subnet IP range eg: 192.168.0.1 – 192.168.0.255)
- Import Hosts from a File
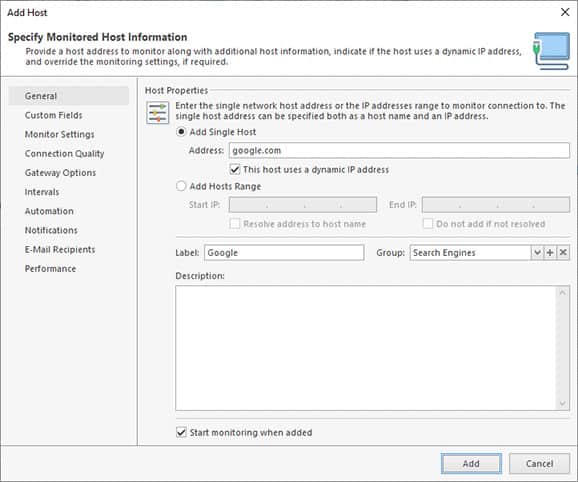
Once you've specified the hosts to scan or import and click the ADD button, EMCO Ping Monitor will immediately start monitoring each of the hosts it finds or imports thereafter.
Configure Host Monitoring Settings and Thresholds
To configure your Host Monitoring thresholds, you'll want to click on the “Monitor Settings” link in the preferences window to see all the settings that can be configured per your standards.
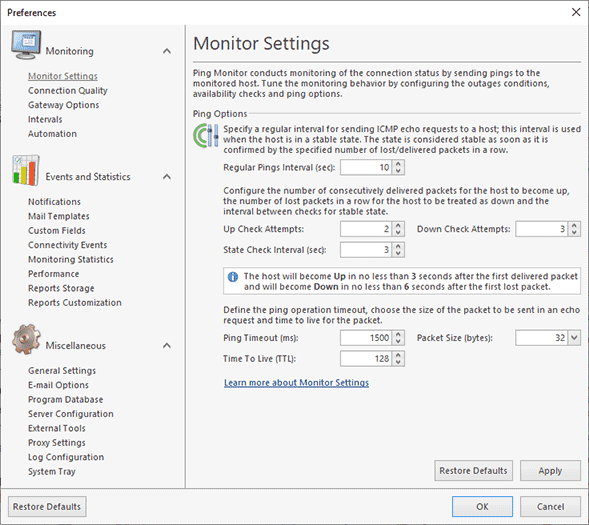
As seen from the image above, the settings that can be configured are as follows:
- Regular Pings Interval:
This is the time between pings that EMCO ping monitor uses to space out how often it sends pings to a stable host. A host will become STABLE after its received a specified amount of delivered packets consecutively. - Up Check Attempts:
This is the number of pings in a row that tells EMCO software that a connection has been established to the host. - Down Check Attempts:
This number is the threshold for the number of consecutively lost packets tells the software a host has lost its connection or is DOWN. - State Check Interval:
This interval is the time in seconds between pings when a host is considered UNSTABLE, meaning neither UP or DOWN. - Ping Timeout:
Time in MS (milliseconds) that the ping command waits to hear from the host that its pinging. - Packet Size:
This is the packet size in “bytes” of the ICMP echo request packet. - Time To Live (TTL):
TTL (time to live) is the time a packet has to live and is incrementally reduced by every host on its route to the destination. When TTL hits ZERO, the packet is discarded and an error will be sent back – the main purpose of TTL is to ensure a packet doesn't keep going around the internet as an undeliverable packet.
Connection Quality Settings
After configuring the Monitor Settings in the preferences menu, you can click the very next link down that says “Connection Quality“.
As seen in the image below, you can setup parameters for the ping monitor that will assist in determining the connection quality that you have to the host/s you are monitoring.
These connection quality metrics assist admins in pinpointing hosts that have issues with their connection quality and can help you pinpoint issues in networking devices or hardware before a failure occurs.
Settings for connection quality include:
- Sample Size
This field is used for the number of pings (ordered by Latest) to be used for calculating connection quality. (Note: EMCO ping monitor can still estimate your connection quality even if it doesn't have the specified amount of pings to match the Sample size specified in this field) - Estimate Quality Since
This field states the minimum number of responses sufficient to estimate the quality of the connection. - Latency Percentile
The Latency Percentile is what is used to separate the greater & lesser parts of the round-trip times data set.
Client/Server Setup
One feature that we quite like is from the Enterprise Edition of EMCO Ping Monitor – The client/server setup.
They recommend installing the ping monitor server portion of the installation on a Windows Server that is online at all times of the day/year.
This allows for the monitor service to run continuously throughout the day/month/year.
The client portion of the Enterprise Edition software suite can be installed on any other client machine/laptop.
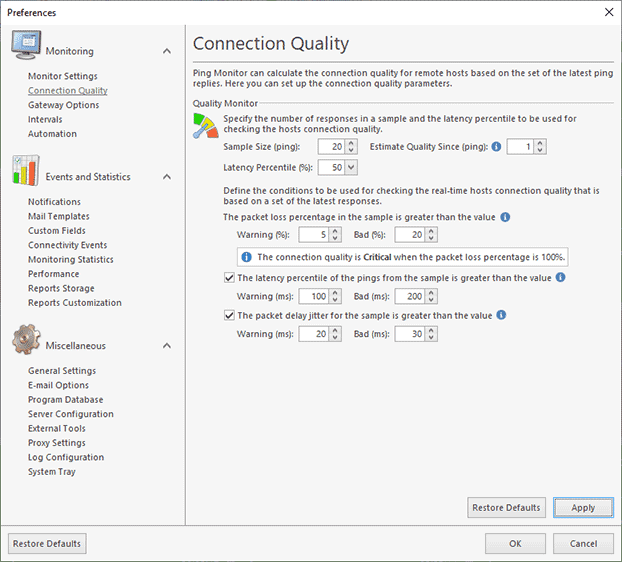
You are given the option to connect via LAN, WAN and even over VPN to the Server.
You can also have multiple clients connect to the server if other technicians, engineers or admins need to keep tabs on your infrastructure as well.
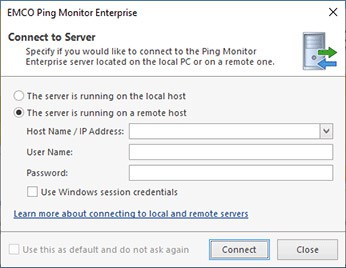
Furthermore, if you want to have multiple users, you can configure access to the server as a more granular level if needed, by only allow certain windows users or groups to access certain roles on the EMCO Server, including read-only access or full admin privileges, as seen below.
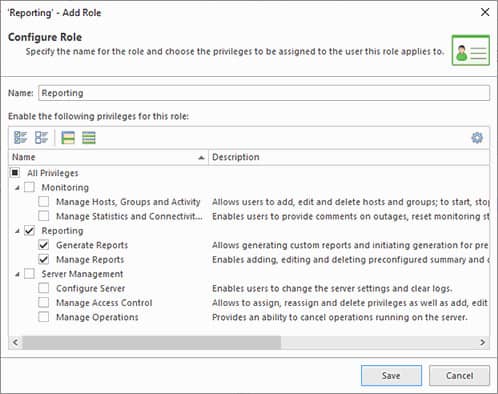
Once you've assigned the correctly privileges to your clients/users, you can go ahead and connect to the server by either using its ip address or DNS/Netbios name via a Browser.
One of the main reasons we love EMCO Ping Monitor is due to the agentless monitoring capabilities it has.
EMCO uses ICMP pings to monitor host connections (up/down or pending) and connection quality of any host you specify in the dashboard.
Furthermore, EMCO Ping monitor gives your statistical analysis of a selected period of time that will give you further insights into connection and ping issues.
Being an agentless monitoring tool gives this tool the benefits of not having to install monitoring agents on the machine you are monitoring.
This makes setup easy and to the point when initially setting up the software suite to monitor your most critical machines.
Web User Interface & Controls
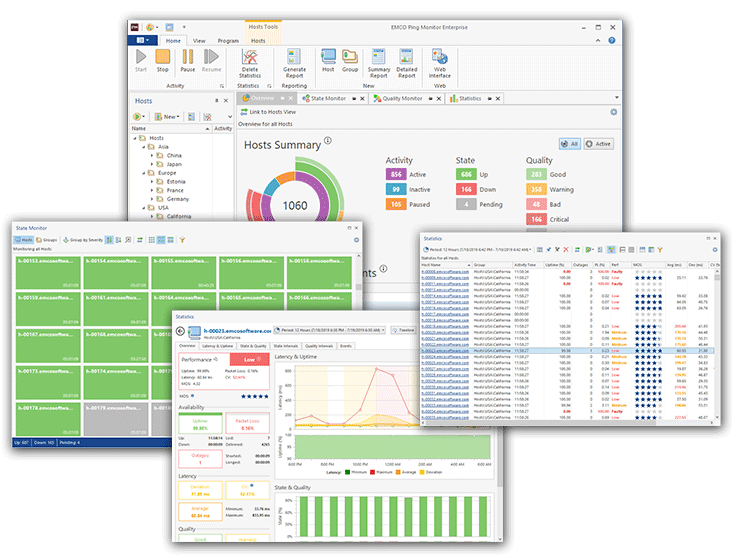
The interface of EMCO Ping Monitor is broken up into 4 Main tabs:
- Overview
- State Monitor
- Quality Monitor
- Statistics
Each of these tabs shows you more in-depth information about your network and servers/hosts along with critical information.
Overview Tab
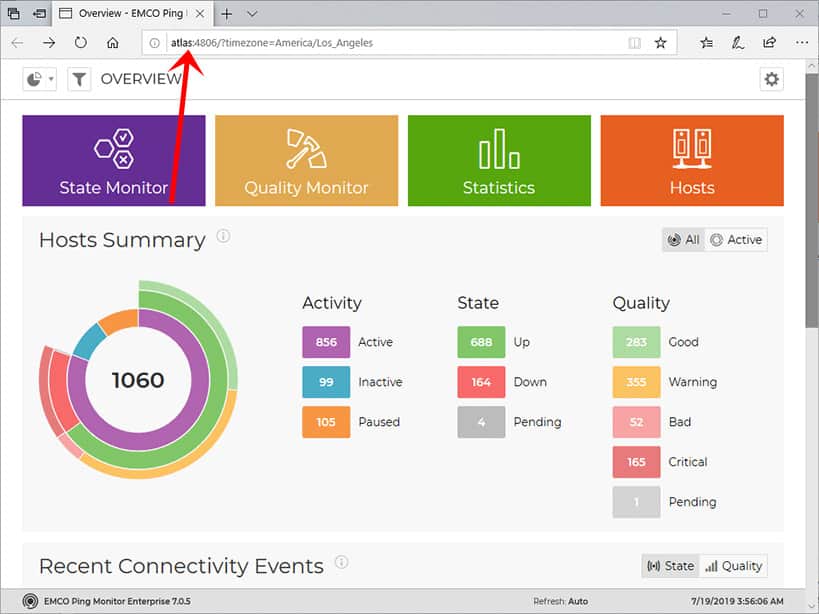
Once you open the program, you'll be great with the Overview tab/panel that will you give a summarized and high-level overview (as the name suggest) of your hosts in your network.
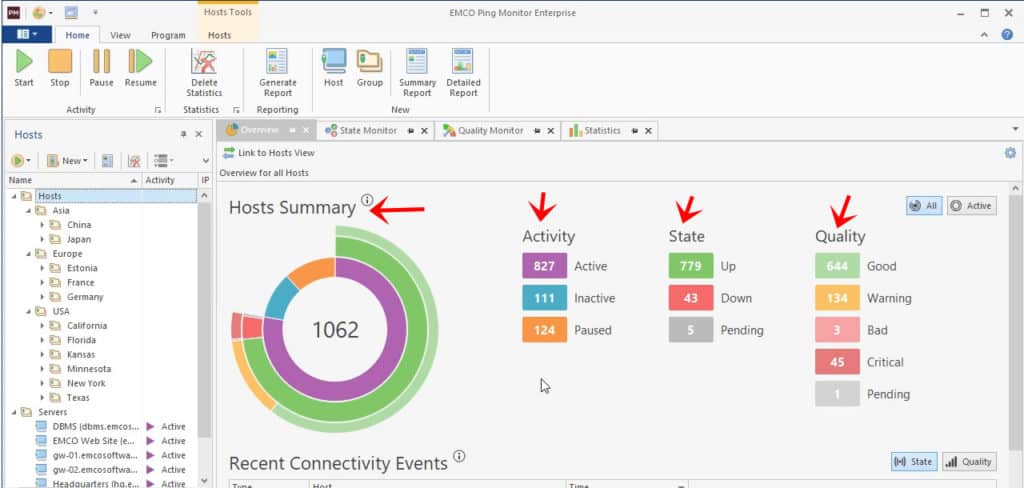
You'll see 4 main areas that we've highlighted above that you can quickly glance at to see the state of your hosts.
The Host Summary gives you wide overview of your entire monitoring infrastructure, along with the number of hosts you are currently monitoring.
The Activity column gives you 3 color coded fields that show how many hosts are either Active, Inactive or Paused.
The State column tells you how many of your hosts are reporting UP, DOWN or PENDING.
The last column, Quality, gives you a numerical value for each level of quality that the Ping Monitor has to a host.
State Monitor View
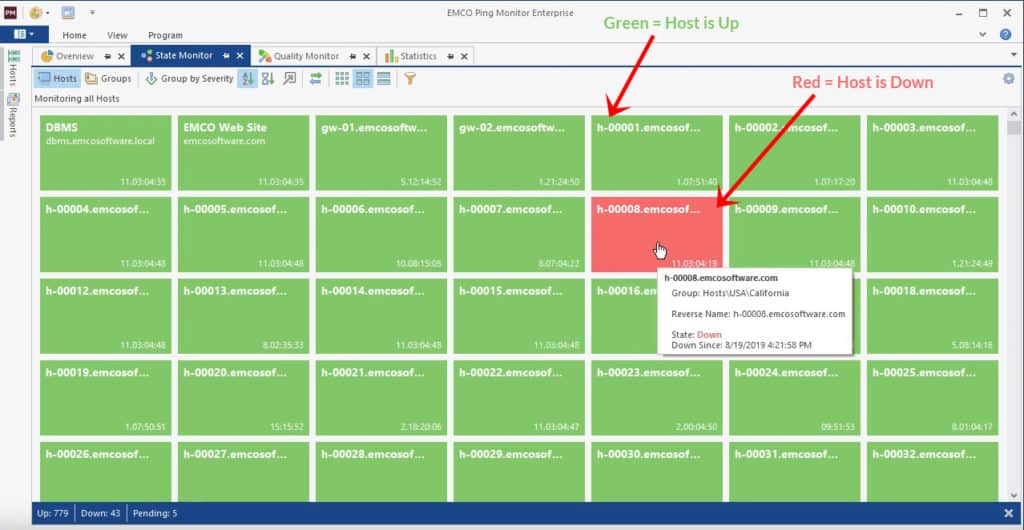
The “State Monitor” tab shows the current state of each of the hosts your monitoring which are conveniently color coded to show you quickly with hosts are in a up state (Green) or down state (Red).
When a host goes from online to offline, the color will change subsequently from green to red, and vice-versa when it comes back online.
The host will only change colors (or states) if it fails to respond to a pre-configured number of pings before the state changes.
All these settings can be adjusted to your preferences as well.
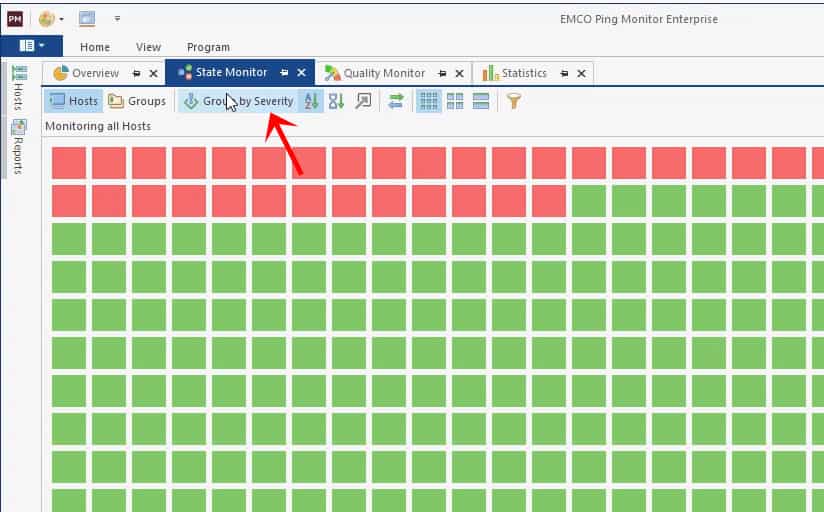
You can further more switch the view to show all the down hosts at the top of the page and so forth, as well as by severity, etc.
You can also use the built-in Filter feature that allows you to only view a certain state that a host is in, or multiple states:
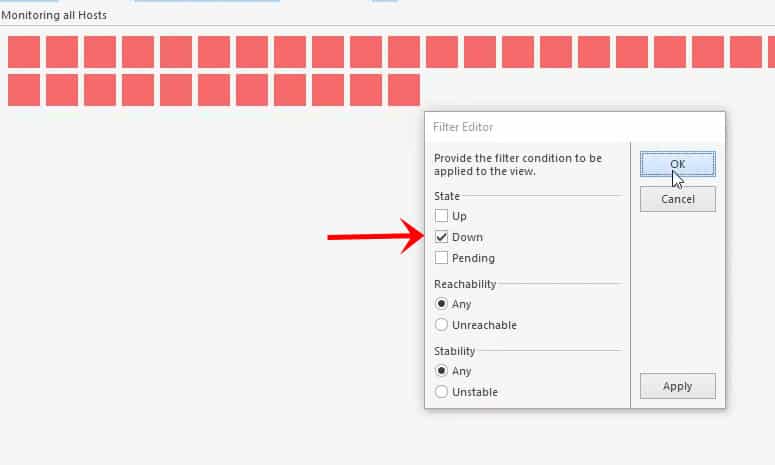
This feature is quite useful, as you can set this feature to only view down hosts and quickly troubleshoot them in order to get them back online.
More information and Documentation can be found here about the State Monitor View: https://emcosoftware.com/ping-monitor/doc/state-monitor-view
Quality Monitor View
This view shows the current connection quality of each host that your monitoring.
These are also nicely color coded as well, to show either one of the following connections:
- Good = Green
- Warning = Yellow (Thresholds: Packet loss > 5% | Latency > 140ms | Jitter > 20ms)
- Critical = Red (Thresholds: Packet loss > 20% | Latency > 300ms | Jitter > 30ms)
- Pending = Gray
These status colors can also be further filtered down as well (like the above section) to give you insights into only the hosts that have quality issues that you want to pinpoint:
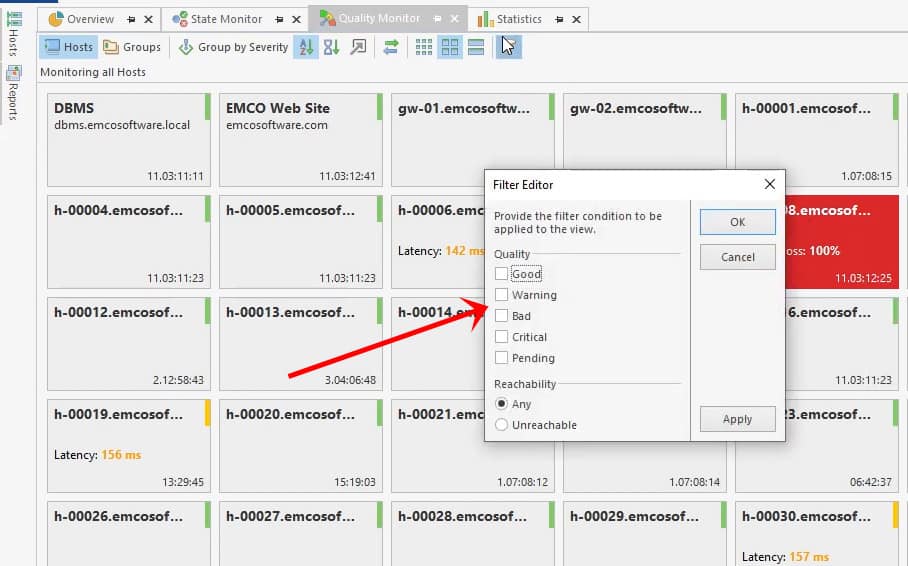
After you've set your filters (or not), you can simply click on the host you want see more details for and you'll be presented with a view of that particular host, along with its latency (in ms), quality, jitter and packet loss information.
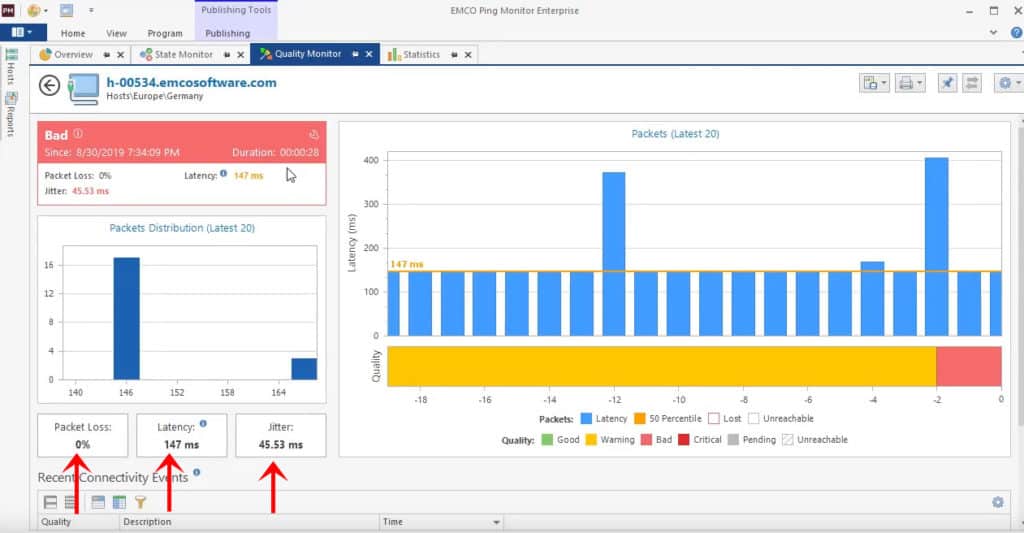
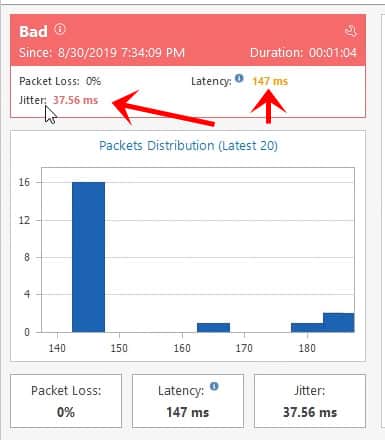
The value/parameter that has exceeded the specified threshold will be highlighted in the color that represents the aforementioned thresholds, as you can see in this case, the jitter is red (bad state) and the latency is in a yellow (warning) state:
More information and documentation can be found here about the Quality Monitor View: https://emcosoftware.com/ping-monitor/doc/quality-monitor-view
Statistics View
On top of the other 3 tabs/views we've gone over above, the statistics view gives you an option to set historical dates for viewing connection quality metrics directly on the dashboard, as seen below in the statistics tab below:
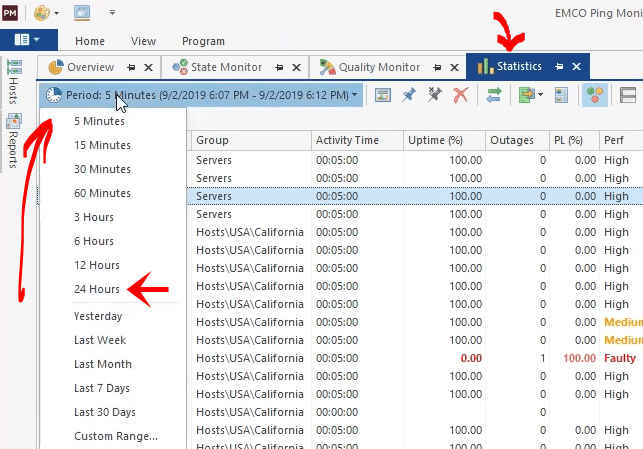
After setting the historical period you wish to view statistics for, you can sort by any number of columns listed in the view, including:
- Uptime percentage
- Number of outages
- Packet loss percentage (%)
- Performance (which is the performance calculated by the monitoring statistics)
- MOS (Mean opinion score that is used for rating voip quality)
- and many other statistics that give you insightful information into your hosts.
You can see all the statistics you can sort by on the Statistic View page here.
Furthermore, clicking on a specific host will bring you the host specific page that will give you a historical overview of the hosts' statistics in greater detail, as seen below:
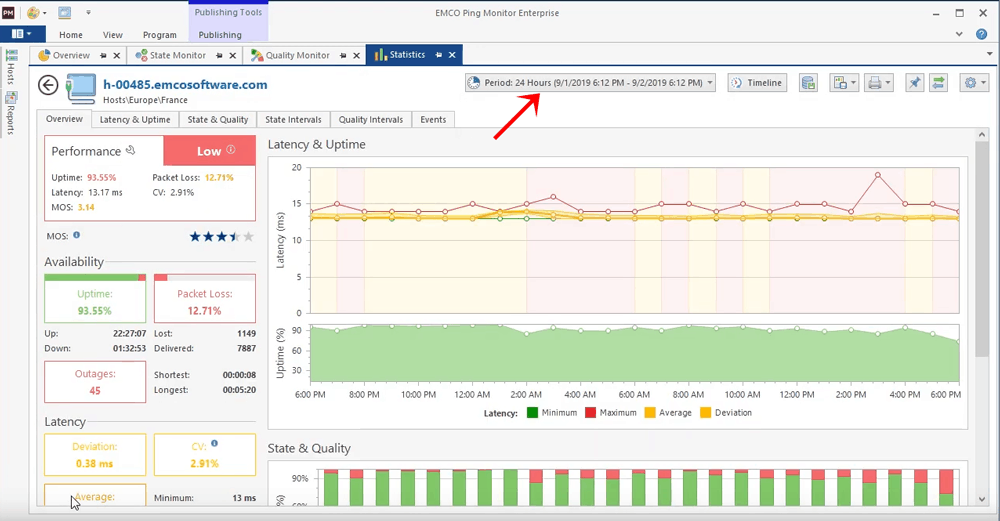
You can see more information about the Statistic View here: https://emcosoftware.com/ping-monitor/doc/statistics-view
Notifications, Reports & Event Logging
One of the more important features we look for in ping monitoring software is the notifications and reports of our infrastructure, as well as historical event logging.
Event logging occurs on a host level in EMCO ping monitor and are available to view in the event page of your hosts' detailed statistics view (which can be seen in the Statistics tab).
To view a log of connectivity events, click on the tab at the bottom that says Connectivity Events and you'll have a list that is sortable by date, state, quality and etc to view.
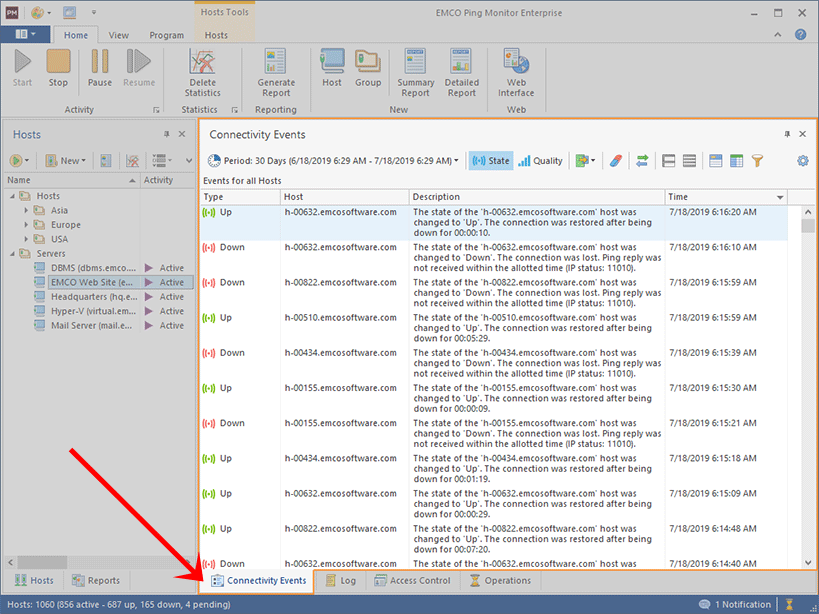
This view allows you to switch between state or quality (as seen from the 2 buttons in the top middle page of the middle above) event views to see information about your hosts' state or quality issues and performance.
Reports
EMCO Ping Monitor comes pre-bundled with some great reports that are based on historical data that the program stores from your host uptime/down-times.
There are options to send reports via email that can be stored either locally or on a remote FTP server as well – Learn how to setup an ftp server on windows 7.
Their are 2 types of reports that EMCO ping monitor can generate:
- Summary
- Detailed
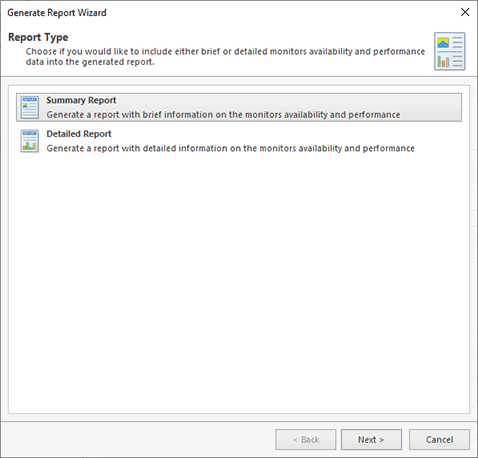
As you can imagine, the Summary reports provide a quick summary of the monitors performance & availability in a table forma where each row is a host.
The Detailed reports has much more details in regards to the data range being used, including response times, availability, activity and much more. You can change what is generated in your reports from the report output settings.
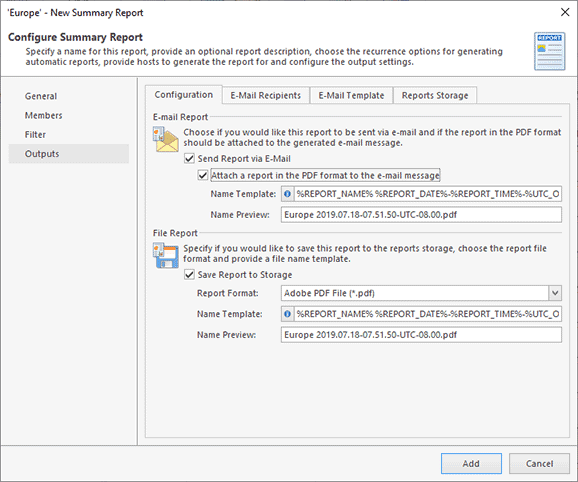
You can dial in the reports that you generate from the type of report, the members your want the report to be sent to, filters (for including/excluding hosts and downtime percentages) and then the output of the actual report, as seen in the above image.
Other notable features of the event & notification system:
- Configurable mail templates with custom HTML and variable use!
- Live and historical data collection, statistics and report generation!
- Configure your performance metrics and thresholds to your own standards and SLA's.
- Customize reports with company logo, header and footer text/images and much more!
All Reporting features are listed in full detail here: https://emcosoftware.com/ping-monitor/doc/reporting
EMCO Ping Monitor Pros&Cons
Pros:
- Can create PDF or HTML reports with ease
- Users can script powerful automations and scheduled tasks
- Can run as either a service or application
Cons:
- Cluttered interface feels outdated and overwhelming
- Marketed more towards network professionals
- Available only for Windows
Conclusion
Going over this nifty software gave us some great insights into EMCO's thought process and how thorough this ping monitoring tool really is. They've given admins and network engineers the flexibility and complete control over their host monitoring software to allow us to configure and tweak as we please.
We love the simple to use interface and as a team of 4 people here, we definitely love the client/server Enterprise Edition that they've put together.
This gives all admins access to the same information and helps dial in our host monitoring settings exactly how we need.
PRO TIP:
FREE SMS notifications: We're based in the USA and use Verizon wireless for our cellular coverage.
We've found a great trick to allow notification alerts to come to our phones without having to pay anything extra or pay for a 3rd party SMS service!
In order to get critical downtime alerts via e-mail direct to your phone, we used our MMS Verizon specific email (number@vzwpix.com) in the TO: field in the email options configuration page. This will send use an email to text message directly to our phones without a 3rd party SMS service involved.
We tried using the SMS Verizon specific email (number@vtext.com), but that message was cut off after 140 character limit was reached.
All in all, we love the sheer amount of flexibility this Ping tool has and would highly recommend the Enterprise version to anyone who is working in a Small-Medium business environment, as it has the necessary features to give you the data your need and the option to customize almost everything with how you want!
They have 3 versions available for download, including a free version that gives you limited features, along with a Pro Version and Enterprise version for Purchase:
FREE EDITION
100% Free!
- The Free edition allows monitoring up to 5 hosts.
- It does not allow any specific configuration for hosts.
- It runs as a Windows program, so monitoring is stopped if you close the UI or log off from Windows.
PRO EDITION
$199 Single License
- The Professional edition allows monitoring up to 250 hosts.
- Every host can have a custom configuration, such as monitoring settings and e-mail recipients of notifications.
- It runs as a Windows service, so monitoring continues even if you close the UI or log off from Windows.
Enterprise EDITION
$445 Single License
- The Enterprise edition includes all the available features. It is possible to monitor 2500+ hosts depending on the used hardware.
- This edition offers client/server features, so the server works as a Windows service to ensure ping monitoring in the 24/7 mode. Multiple clients can connect to the same server and work simultaneously.
- This edition has a monitoring web interface. It also has a special host-state and connection-quality monitoring views designed for control rooms to display statuses of all hosts on a single screen.
See all Editions and compare them in detail, please see the image below or visit this Page on EMCO's site.
EMCO Ping Monitor FAQs
What is EMCO Ping Monitor?
EMCO Ping Monitor is a network monitoring tool that allows organizations to monitor the availability and performance of network devices and services. It uses ping-based monitoring to check the response times and packet loss rates of network devices, and provides real-time alerts and reporting on any issues detected.
What types of devices can EMCO Ping Monitor monitor?
EMCO Ping Monitor can monitor a wide range of network devices, including routers, switches, servers, printers, and other network-enabled devices. It can also monitor network services like DNS, HTTP, FTP, and SMTP.
What are some key features of EMCO Ping Monitor?
Some key features of EMCO Ping Monitor include real-time monitoring and alerts, customizable monitoring parameters, graphical reporting and analysis, historical data logging, and remote monitoring capabilities.
How does EMCO Ping Monitor work?
EMCO Ping Monitor uses ICMP (Internet Control Message Protocol) to send ping requests to network devices and services. It measures the response times and packet loss rates of the devices or services, and generates real-time alerts if any issues are detected. The tool also provides detailed reporting and analysis on network performance and availability.
What are some benefits of using EMCO Ping Monitor?
Some benefits of using EMCO Ping Monitor include improved network visibility and performance, faster detection and resolution of network issues, reduced downtime and lost productivity, and enhanced network security through proactive monitoring.
How can I get started with EMCO Ping Monitor?
To get started with EMCO Ping Monitor, you can download a free trial from the EMCO website. Once installed, you can configure the tool to monitor your network devices and services, set up alerts and notifications, and generate reports on network performance and availability. The tool is designed to be user-friendly and can be configured without extensive technical expertise.

