Containerization is a popular approach for building and deploying applications today. Though it offers many benefits, monitoring them can be challenging, and requires the use of advanced tools.
In general, containerization offers many benefits, like portability, scalability, and agility. The individual containers enable developers to package applications and their dependencies into lightweight and isolated environments that can run in different environments, from development to production. Since these containers form the stratum for your applications, you must continuously monitor and manage them.
In this context, container monitoring involves collecting metrics, logs, and events related to container activity. Using this information, you can detect issues, identify trends, and optimize performance. However, effective container monitoring requires a combination of tools and techniques that can monitor containers at the host, application, and infrastructure levels.
Here is our list of the best container tools:
- Site24x7 – EDITOR’S CHOICE This cloud-based platform provides full stack observability for IT systems and that includes monitoring for containers. This system will also monitor virtualizations and virtual networks. Get a 30-day free trial.
- Dynatrace It provides real-time insights into your dynamic container environments for workload instrumentation and troubleshooting.
- Sematext This scalable and native container monitoring tool helps overcome challenges by offering detailed visibility.
- Datadog It offers multidimensional visibility into your containerized environments, so you can monitor the health and performance of your applications.
- SolarWinds Server and Application Monitor Comprehensive tool provides the visibility you need to manage and monitor your containers.
- New Relic This platform monitors your containers to identify the gaps that exist between the performance of your applications and their containers.
In this article, we'll explore some of the best container monitoring tools. But before that, a brief understanding of what container monitoring can do for your organization.
Why Do You Need Container Monitoring?
Container monitoring ensures the reliability, scalability, and security of container-based applications and also helps troubleshoot issues quickly and proactively. Container monitoring can help your organization in the following ways.
- Optimizes the Performance of Your Containers Container monitoring optimizes the performance of containerized applications. Essentially, it identifies resource-intensive processes, bottlenecks, and inefficiencies by monitoring different metrics like CPU utilization, memory usage, and network traffic. You can even use these metrics to identify performance issues and fine-tune container configurations to improve efficiency and reduce costs.
- Detects Issues Proactively With the right container monitoring tool, you can detect issues quickly before they impact application performance or availability. By monitoring key metrics and alerts, you can prevent problems from escalating into service disruptions.
- Helps with Capacity Planning You can use container monitoring to understand resource utilization patterns over time. Armed with this information, you can plan for future capacity requirements. Also, by monitoring usage trends in CPU, memory, and network usage, you can adjust container deployments accordingly.
- Keeps your Applications Secure Container monitoring stays on top of network traffic and access patterns to detect security threats and vulnerabilities. It analyzes container logs and events to identify abnormal activity, so you can take appropriate action to prevent security breaches.
- Meets Compliance Requirements Container monitoring keeps track of access controls, permissions, and audit logs to ensure compliance with regulatory requirements and internal policies. By tracking user activity and resource usage, you can ensure compliance with industry standards and internal policies.
Overall, container monitoring maintains the health, reliability, and security of your containerized applications and infrastructure.
The Best Container Monitoring Tools
Now that you know how container monitoring can benefit your organization, let's look at some of the best tools available today. Let's talk about the features of each of these tools, so you can decide the one that's well-suited for your business.
1. Site24x7 – FREE TRIAL
Site24x7 offers container monitoring as part of its full stack observability services that are delivered from the cloud. Your containers can be hosted on your own servers or on a cloud platform. The system can track the performance of Docker, OpenShift, and Kubernetes.
Key Features:
Real-Time Monitoring: An advanced container monitoring service designed to offer comprehensive visibility into containerized environments. It provides real-time monitoring for containerized applications running in Docker, Kubernetes, and OpenShift, helping businesses ensure that their containerized workloads are running efficiently.
- Resource Usage Statistics: By capturing critical metrics such as CPU usage, memory consumption, network traffic, and disk I/O, Site24x7 allows administrators to track the health of containers, pods, and nodes across clusters. This visibility ensures that performance issues or resource constraints within containers are promptly identified, enabling swift troubleshooting and remediation.
- System Discovery: The platform supports auto-discovery of containers and clusters, streamlining the monitoring setup process. This process populates the monitoring dashboard, which means that the Web-based console is very easy to set up. Rescans ensure that asset inventories are kept constantly and automatically up to date.
- Operations Tracking: Integration with Kubernetes and Docker allows for deeper insights into cluster health, including pod scheduling, deployment status, and container-level performance. Site24x7’s detailed reporting features further aid in optimizing containerized environments by providing actionable insights into resource utilization, which is critical for scaling container-based applications effectively.
- Alerts for Performance and Security Issues: Site24x7 offers alerting and anomaly detection features, ensuring proactive management of container environments. Administrators can set thresholds for various metrics and receive instant alerts whenever a container or pod crosses a predefined limit, enabling immediate intervention before issues impact end users.
Site24x7’s container monitoring service integrates with other infrastructure monitoring tools, providing an end-to-end solution for organizations operating in hybrid, multi-cloud, or on-premises environments.
Pricing: Starts at $9 per month for the Infrastructure Monitoring package. You can examine the entire Site24x7 platform with a 30-day free trial.
EDITOR'S CHOICE
Site24x7 is our top pick for a container monitoring tool because it offers a comprehensive and user-friendly solution for monitoring containerized applications across environments like Docker, Kubernetes, and OpenShift. With deep visibility into container health and performance, Site24x7 enables administrators to track critical metrics such as CPU, memory, network traffic, and disk I/O for containers, pods, and nodes. This helps ensure containers are running efficiently and optimally, reducing the risk of performance bottlenecks or resource contention that could disrupt application availability. An important service in the Site24x7 container monitoring system is its auto-discovery feature, which automatically detects containers and clusters, simplifying the setup process and ensuring that all components are being monitored. The platform provides real-time performance monitoring with customizable dashboards, offering a clear overview of your containerized infrastructure’s health. Site24x7’s integration with Kubernetes and Docker allows detailed insights into pod scheduling, deployment statuses, and container-specific performance metrics, which helps in proactive troubleshooting and optimization. The platform also features alerts, with users able to set thresholds for various metrics and receive instant notifications when performance issues arise. This ensures timely intervention to prevent disruptions. Moreover, Site24x7’s scalability makes it suitable for businesses of all sizes, whether they’re running small-scale container deployments or large-scale enterprise environments.
Download: Access a 30-day FREE Trial
Official Site: https://www.site24x7.com/signup.html?pack=44&l=en
OS: Cloud-based
2. Dynatrace

Dynatrace's container monitoring capabilities analyze your workload and provide detailed information on its performance. It collects metrics, logs, and other observability data to help you improve the overall health and performance of your containers.
Let's now look at a few key capabilities of Dynatrace.
Key Features:
- Automatically Discovers Containers: A key feature of Dynatrace is that it automatically identifies the containers in your network and creates a map of your entire environment. A mere glance at this map will tell you all about containers, the applications they hold, and their dependencies with other containers. The best part is that Dynatrace presents this information in real-time, so you can immediately know which containers are not working.
- In-depth Insights into Container Performance Across Applications: Dynatrace works well across multiple containers and environments. This means Dynatrace can tell you all that's going on within your complete environment. It collects metrics, analyzes them, and presents the insights in a form that's easy to understand. Undoubtedly, you can use this information to better orchestrate your environment.
- A Unified Platform for All Technologies: Dynatrace is a unified platform that works well with multiple technologies. Essentially, with Dynatrace, it's enough if you deploy once on a host. Regardless of the number of containers or their platform, this single agent will collect all metrics for you. Needless to say, this single installation simplifies container monitoring.
Overall, Dynatrace is an automatic workload instrumentation platform that can identify blind spots and automate their remediation.
Dynatrace offers a ton of flexibility in pricing, so you pay only for what you use. Here's the rate card.
- Full-stack monitoring: $0.08/hour for an 8 GB host.
- Infrastructure monitoring: $0.04/hour
- Application security: $0.018/hour for an 8 GB host.
- Real user monitoring: $0.00225/session
- Synthetic monitoring: $0.001/synthetic request
Enjoy a 15-day free trial.
3. Sematext

Sematext is a native and lightweight container monitoring tool that collects all pertinent metrics from different container platforms like Kubernetes, Docker, and more. The Sematext agent runs as a DaemonSet and with a simple “docker run” command, depending on your preference.

Key Features:
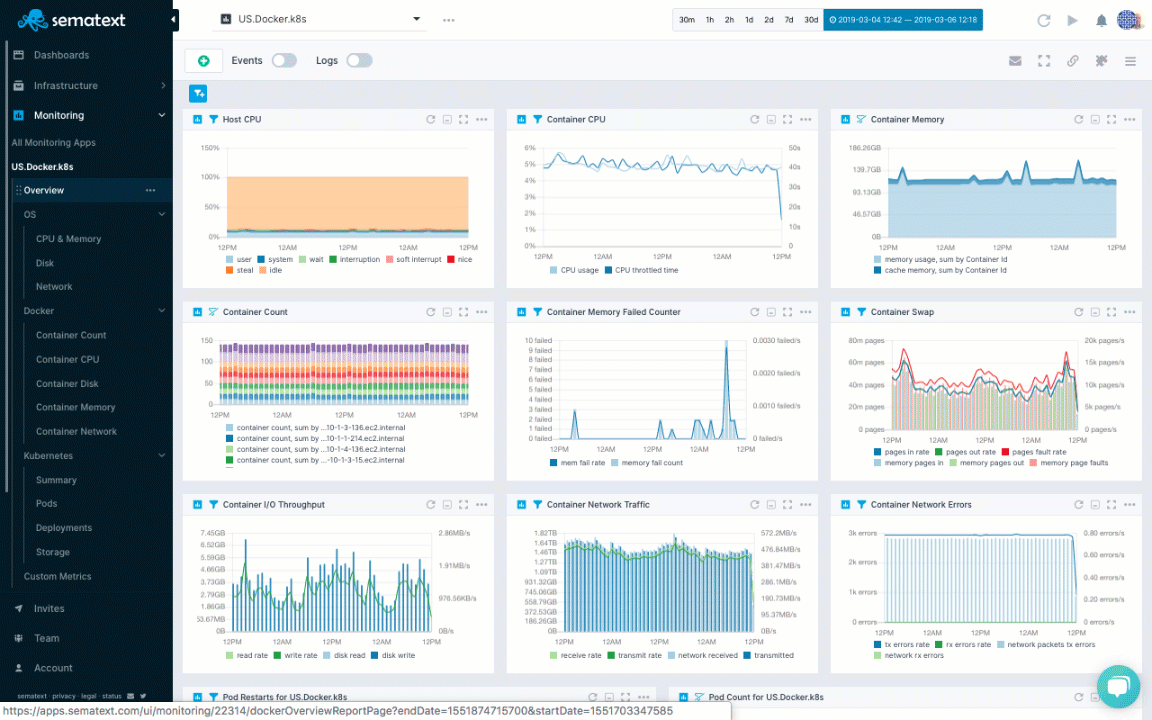
- Flexible and Configurable Dashboards Sematext offers monitoring dashboards out of the box. It collects a host of metrics like CPU, memory, network traffic, IO disk, and more. It also analyzes these metrics and displays them on the dashboard to help you quickly understand and identify trends. You can also customize the layout of the dashboard and change the alert rules to meet your specific objectives.
- Auto-discovery of Your Containers In the dynamic world of containers, Sematext can automatically discover them for you. It even maps the dependencies, so you can always stay on top of all that's happening in your infrastructure. Also, these monitoring agents start automatically when an application starts, so there's no manual effort involved.
- Quick Troubleshooting with Relevant Data Sematext provides monitoring insights in real-time, regardless of whether you deploy containers manually or have an orchestration tool for the same. With Sematext, you can view information about the hot containers, top processes, and other relevant information in real time. Undoubtedly, all this information can reduce the time and effort involved in troubleshooting.
In all, Sematext is a unified solution for your container environment. It's also easy to install and provides insights in real-time for informed decision-making.
Sematext offers three pricing editions:
- Basic: FREE. A maximum of five hosts and the retention period is just 30 minutes.
- Standard: $3.60/month. Supports five containers per host and unlimited hosts. The retention period is seven days.
- Pro: $5.76/month. Supports eight containers per host and unlimited hosts. The retention period is seven days.
Sign up for a free trial to better evaluate how Sematext fits into your environment.
4. Datadog

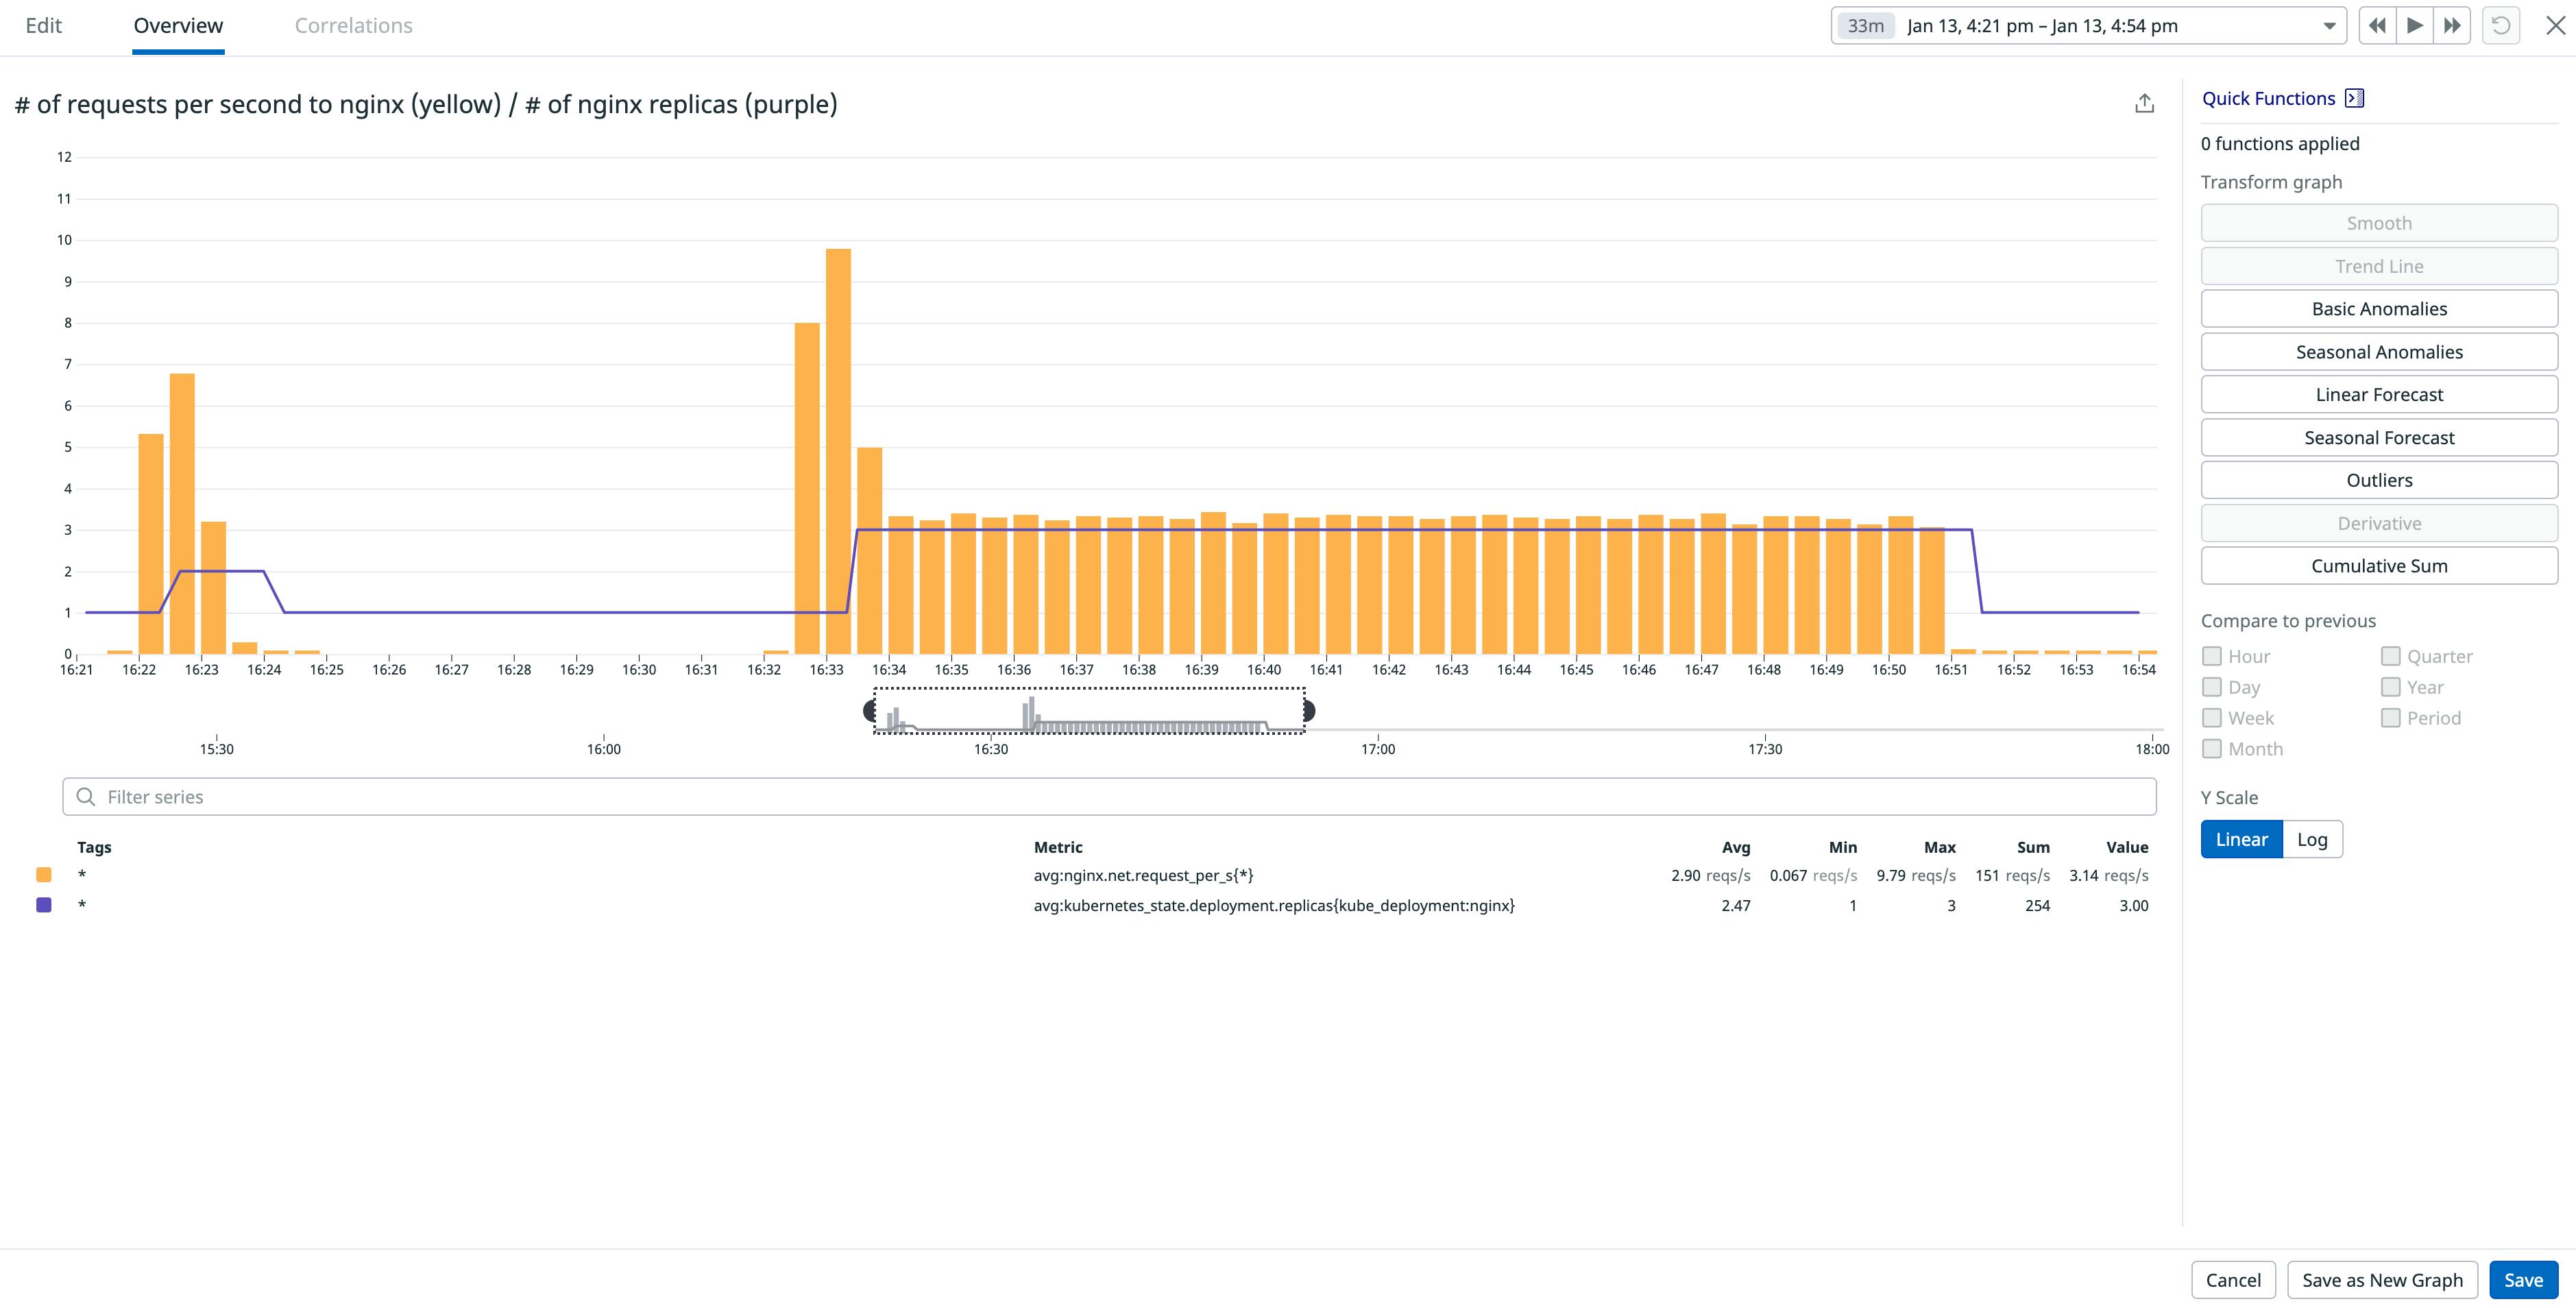
Datadog is an advanced monitoring tool that provides comprehensive insights into the key metrics of your containerized applications. Armed with this information, you can correlate the metrics and get the visibility you need to monitor the health and performance of your containers and the applications they hold.
Below are some ways in which Datadog can boost your container environment.
Key Features:
- Provides Complete Visibility into Your Containerized Infrastructure: Datadog provides critical information about every layer of your container. Such a multidimensional view of your workload can provide the rich insights you need to understand all that's going on in your containers. More importantly, Datadog can automatically correlate the metrics, logs, and other data to provide the information you need for quick and efficient troubleshooting.
- Monitors Serverless Containers: With Datadog's turn-key integrations for AWS, Azure, and Google Cloud, it can monitor serverless containers as well. The advantage is that these integrations can isolate problems in containers, so you can fix them right away. It also supports distributed tracing across multiple components.
- Detailed Notifications and Communication: A key part of monitoring is sending notifications, and Datadog sends notifications when it detects any anomalous or suspicious activity. Also, its machine learning-based insights help identify threats in real-time and notify you right away, so you can take corrective action.
In all, Datadog provides real-time visibility across all your containers for easy troubleshooting across containers and container-based microservices.
Datadog offers extensive flexibility in pricing. Check out the details to know which plan is right for you. Start a free trial of Datadog.
5. SolarWinds Server and Application Monitor (SAM)

The Server and Application Monitor (SAM) provides detailed insights into the performance of your containers. In the process, it speeds up the troubleshooting process as well. In particular, SAM works well on both Windows and Linux-based containers like Docker, Kubernetes, and Apache Mesos.
Key Features:
- Optimizes your Azure IaaS: With SAM, you can continuously monitor the performance of your Azure IaaS services and applications. Some key metrics that you can track include CPU, latency, IOPS, etc. With this information, you can ensure the optimal health and performance of your container applications. It's even possible to identify newly-discovered VMs and containers, and their dynamic mapping with other applications in your environment. Armed with visibility, you can quickly know which containers are working sub-par and the reasons for the same.
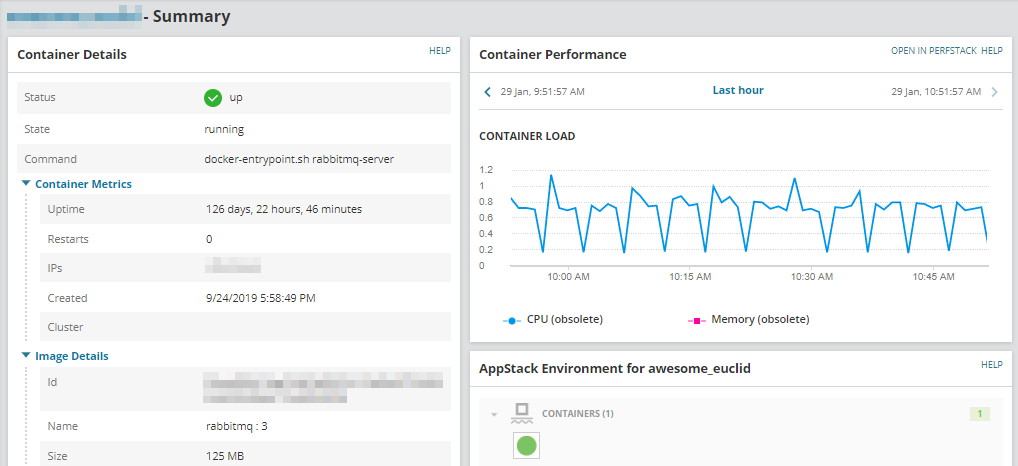
- Provides a Visualization of your Key Metrics: While gathering metrics is one part, gleaning rich insights is what completes the process. SolarWinds presents a detailed visualization of all your key metrics, so you can quickly identify patterns and anomalies. The dashboards on which SAM displays all your data are highly customizable to meet your specific preferences. Also, you can dig deep into these visuals to detect issues in the container as well as the application.
- A Single Tool for Monitoring Multiple Deployments: SolarWinds SAM acts as a single platform for monitoring multiple containers and deployments. Most organizations today need multiple containers, but their performance can take a hit due to the shared resources. SAM works around this problem by isolating containers, so you can quickly identify the issues even if there are multiple containers on the same host. Using this information, you can better optimize your containers for improved performance and stability.
In all, SolarWinds SAM eases the process of monitoring your containers and the applications they run. It helps to visualize your environment and optimize the performance of containers.
Pricing starts at $1,813. Try SAM for free. You can even sign up for an interactive demo.
6. New Relic

New Relic is a comprehensive observability tool designed for engineers and experts to monitor and debug their container environments. It comes with more than 550 integrations to suit all platforms.

Here are some things you can do with New Relic's container monitoring capabilities.
Key Features:
- Offers Comprehensive Visibility Into Your Containers A key advantage of New Relic is that it provides insights into the multiple layers of your containers. In particular, you can look into infrastructure-specific and application-specific metrics, to identify the gaps that exist between your applications and their containers. Armed with this information, you can troubleshoot the underlying issue.
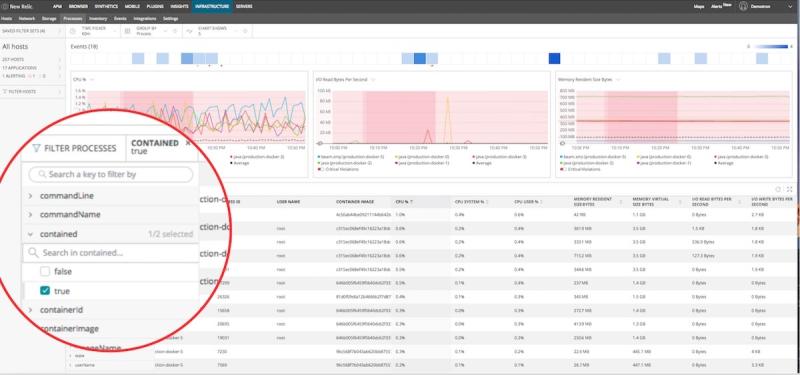
- Detects New Containers New Relic detects new containers and maps them, so you can get a quick and comprehensive view of your container environment. Also, you can see which containers are running what processes, making it easy to identify a multitude of metrics like CPU utilization, memory metrics, and more. This map can also help you uniquely identify containers. All these together provide complete control over your container environment.
- Helps with Troubleshooting Another salient aspect of New Relic is that it collects the required metrics to assess the health and performance of your containers. These metrics help you identify containers that are reaching their memory limit or exceeding their memory requests. It even monitors container restarts, so you can identify and fix the issues causing them.
Overall, New Relic is an end-to-end container monitoring tool that helps you track the health and performance of applications and their respective containers.
The cost depends on the amount of data ingested and the number of users accessing the platform. Get a custom quote for your organization. You can also try New Relic for free.
Final Thoughts
Container monitoring is a critical aspect of managing containerized applications. An effective container monitoring tool helps optimize performance, detect issues proactively, assist with capacity planning, keep applications secure, and meet compliance requirements. Undoubtedly, this means container monitoring is an essential part of your infrastructure.
In this article, we discussed some of the best container monitoring tools available today, including SolarWinds Server and Application Monitor, Dynatrace, Sematext, Datadog, and New Relic. We also explored the key features of these tools for monitoring multiple containers and deployments. Regardless of which tool you choose, investing in container monitoring can help you ensure the reliability, scalability, and security of your containerized applications and infrastructure.
Browse www.ittsystems.com for more product lists.


