If you have to manage and monitor Java applications, the provisions you would need for the activities are Java Management Extensions (JMX).
JMX allows a comprehensive management system to track your applications, raise alarms in the form of notifications when the application needs monitoring, and change the status of the application to correct the problem.
Like SNMP and other management standards, JMX is a public provision supported by most vendors that use similar monitoring applications.
Here’s our list of the best JMX Monitoring tools:
- ManageEngine Applications Manager – EDITOR'S CHOICE A JMX monitoring tool with which you can track Java/J2EE functions that expose management data through JMX. It identifies transactions, threads, and connection pools accountable for absorbing JVM resources. Start a 30-day free trial.
- Site24x7 – FREE TRIAL A cloud-based full-stack observability package that discovers Java applications and their supporting systems, such as JMX, and implements continuous monitoring. Start a 30-day free trial.
- Jolokia A substitute for JSR-160 connectors and a JMX-HTTP link bridge. It is a remote Java Monitoring Extension with JSON over HTTP.
- Zabbix A Java gateway that can redeem data through JMX. It is not a bollard process that is within the Zabbix server.
- Hawt.io A JMX Monitoring Tool that is a scalable web console that manages Java applications and is very accurate. It works flawlessly with any application, be it WebSphere, Tomcat, WebLogic, Liberty, or others.
- Nagios Offers comprehensive monitoring of Java Management Extensions (JMX). Implementing Nagios helps in growing server, services, and application availability.
- AppDynamics Assists you with JMX checking by raising a query for the most helpful JMX metrics right out of the container to guarantee you can track the shared resources that can affect application performance.
What type of management services can JMX help you develop?
JMX provides access to the management application specifications for collecting management data in Java classes while managing and monitoring applications. Most of the time, these Java class specifications are nothing but simple counters to monitor the Java application’s resources. JMX is also used to give rights to procedures in Java classes that initiate or stop processes in the application or reboot the value of the class specifications.
Management data revealed through Java Management Extensions is known as a Managed Bean (MBean). MBeans that show class specifications are known as attributes and procedures displayed through MBeans are known as operations. To view the present value of an MBean attribute, you can use a JMX management utility application. You can also set up JMX monitors to assess the MBean attribute values and issue notifications when the values cross the specified limits.
When is it fitting to use JMX?
Every significant Java EE application that has extensive consumption of resources, like JMS connections, databases, or caches, should have the option of tracking the application's consumption of resources. For all these types of applications that might read or write from the database multiple times, it is ideal to use the JMX application since it is otherwise not practical to use logging options to get results with every read-and-write function. JMX helps you write codes that optimize network resource usage and can easily be managed.
What's more, if your application writes to a data bank or maintains and creates its cache that is outside the limit of the application container, you should consider developing MBeans to track the size of the cache size or the quantity of data written by the bank.
The various layers of JMX
Since JMX is a component-based technology by Java EE, different software vendors provide various components. This division of components allows vendors to develop software under their area of expertise.
JMX manages the components under the below-mentioned layers:
- Instrumentation It comprises all resources, applications you write, and other manageable objects. In this section, developers of the application create Managed Beans (MBeans) which includes the properties or specifications (attributes) and methods or procedures (operations) that they want to reveal to the external management system.
- Agent This layer comprises application servers and the Java Virtual Machine (JVM). It contains a record of MBeans and the common interface for accessing, creating, and destroying MBeans. The agent also helps as a time and monitoring service and allows services to remote clients.
- Distributed Services You have the other Java EE applications in this layer, also known as management consoles. The function of the management console is to receive or send requests from the agent component. This component is often an adapter or a plug-in that allows a management console to help multiple management protocols like JMX and SNMP.
The Rise of JMX Monitoring
Java Management Extensions technology simply provides the standards to manage the JVM resources like devices, applications, and services to monitor the JVM performance. However, drawing out metrics from JMX is not an easy task for developers and admins who want to know more about their applications.
Why You Need To Use JMX Monitoring Tools
There are multiple benefits of using JMX monitoring tools.
- The best part of the JMX monitoring tool is the boundaryless solution. The tool allows you to track your application in real time and includes heavy investments.
- Operating the JMX monitoring tool is simple and reduces the investment and effort required for developing any management tool for tracking applications.
- The JMX monitoring technology provides a common and acceptable way to manage Java systems, applications, and networks.
- You can use the JMX monitoring tools to manage Java Virtual Machine remotely and track it effectively.
- The JMX monitoring technology gives you a dynamic management architecture. You can develop additional services and load, update, and upload the same dynamically in management infrastructure.
- The JMX monitoring technology supports all existing Java technologies.
- Almost all Java technology-ready devices allow JMX technology-based agents to run on them. This makes the Java application more accessible with minimal impact on the design. The Java application needs to embed an object server and allow some server functionalities available as one or multiple managed beans (MBeans) registered in the server.
- The highlight of JMX technologies is that it comfortably merges with the existing management solutions and emerging technologies. Moreover, since the JMX APIs are open source interfaces, any management vendor can implement the same. In addition, JMX technologies can use discovery and lookup services and standards like Service Location Protocol (SLP) and Jini Network technology.
- You can develop the JMX Monitoring applications from a NetBeans IDE module. You can avail of the module from the NetBeans update center that allows you to create JMX applications using the NetBeans IDE. This helps in reducing the cost of creating a JMX application.
The Best JMX Monitoring Tools
The present-day JMX Monitoring Tools are very advanced. They can be fused into the system application easily, helping you automate various features required for monitoring your application server or Java Virtual Machine (JVM).
- Application Profiling
- Session Monitoring
- Threat Monitoring
- Connection Pool Monitoring
- HeapSize Monitoring
- Custom Metrics
Installing and integrating these files are so simple that you can compare them with putting war files into the auto-deploy directory and using it. What's more, the files do not leave a significant mark on the JVM, so there are no additional worries.
Our methodology for selecting JMX monitoring tools and software
We reviewed various JMX monitors and analyzed the options based on the following criteria:
- Alert and reporting capabilities
- Support for various Java metrics
- A facility to analyze network performance over time
- Graphical interpretation of data, such as charts and graphs
- A free trial period, a demo, or a money-back guarantee for a risk-free assessment
- A good price that reflects value for money when compared to the functions offered
1. ManageEngine Applications Manager – FREE TRIAL
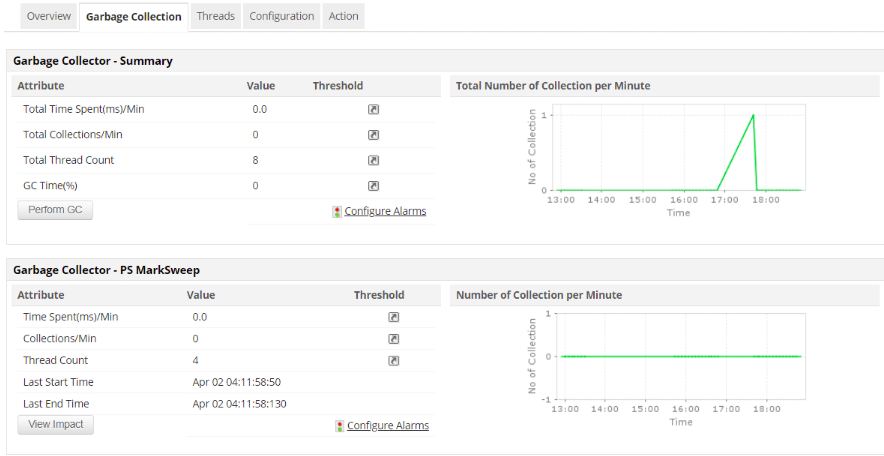
With the JMX monitoring tool ManageEngine Applications Manager, you can track Java/J2EE functions that expose management data through JMX. It identifies transactions, threads, and connection pools accountable for absorbing JVM resources. You can additionally operate thread dumps and analyze them with a Java thread dump analyzer. Applications Manager is a complete monitoring device with a standard and usable interface.
Tracking JMX and customized MBeans can be a difficult task. Still, with the Applications Manager's JMX metrics tracking solution, you can place a query and review any managed beans (MBeans) from your application. As a result, you attain real-time visibility into customized metrics in your utility deployments like the condition of memory management, classification loading, active threads, logging, and platform configuration.
The ManageEngine Applications Manager performs JMX MBean operations and custom scripts to assist directors in taking corrective movements when limitations are breached. In addition, it creates notifications that listen to MBean notifications on particular occasions and reply appropriately.
The JMX monitoring device lets you pick out drifts and correlate metrics from a utility in a gradual transaction. It helps you get out-of-the-box reviews with trending facts and supports JMX 1.2 / JDK 1.5 / MX4J – RMI connector, Weblogic JMX, JBoss JMX, and WebSphere JMX. Applications Manager additionally helps utility servers working on Java model 1.5 and above.
Pros:
- Offers on-premise and cloud deployment options, giving companies more choices for install
- Can highlight interdependencies between applications to map out how performance issues can impact businesses operations
- Offers log monitoring to track metrics like memory usage, disk IO, and cache status, providing a holistic view into your database health
- Can automatically detect databases, server hardware, and devices in real-time
Cons:
- Can take time to fully explore all features and options available
Free trial and download: You can register for this 30-day free trial.
EDITOR'S CHOICE
ManageEngine Applications Manager's JMX monitoring device can automate routine maintenance tasks, rolling upgrades, and more. In addition, you can get notified through electronic mail or SMS when the software becomes indispensable with the assistance of threshold profiles and sample matching.
Download: Get 30-day free trial
Official Site: https://www.manageengine.com/products/applications_manager/java-runtime-monitoring.html
OS: Windows Server
2. Site24x7 – FREE TRIAL
Site24x7 implements JMX monitoring as part of its broad full-stack observability services. This cloud-based system implements Web application monitoring through discovery, code profiling, and distributed tracking. This includes monitoring for all of the supporting systems of Java, such as JMX.
The tool that offers a wide range of features designed to ensure the optimal performance of Java applications. It enables real-time monitoring of critical JMX metrics such as memory usage, thread counts, and garbage collection activities, providing deep insights into application health.
Customizable JMX queries allow users to focus on the specific metrics that matter most to their applications. Proactive alerts ensure that any issues are detected and addressed promptly. The tool integrates with Site24x7 APM Insight, offering a comprehensive view of application performance.
The dashboards and historical data analysis capabilities of Site24x7 make it easy to visualize trends and identify potential areas for optimization. You can access the package with a 30-day free trial.
Pros:
- Real-time monitoring
- Custom JMX queries
- Proactive alerts
- Historical data analysis
Cons:
- No on-premises option
Website link: https://www.site24x7.com/java-application-monitor.html
3. Jolokia
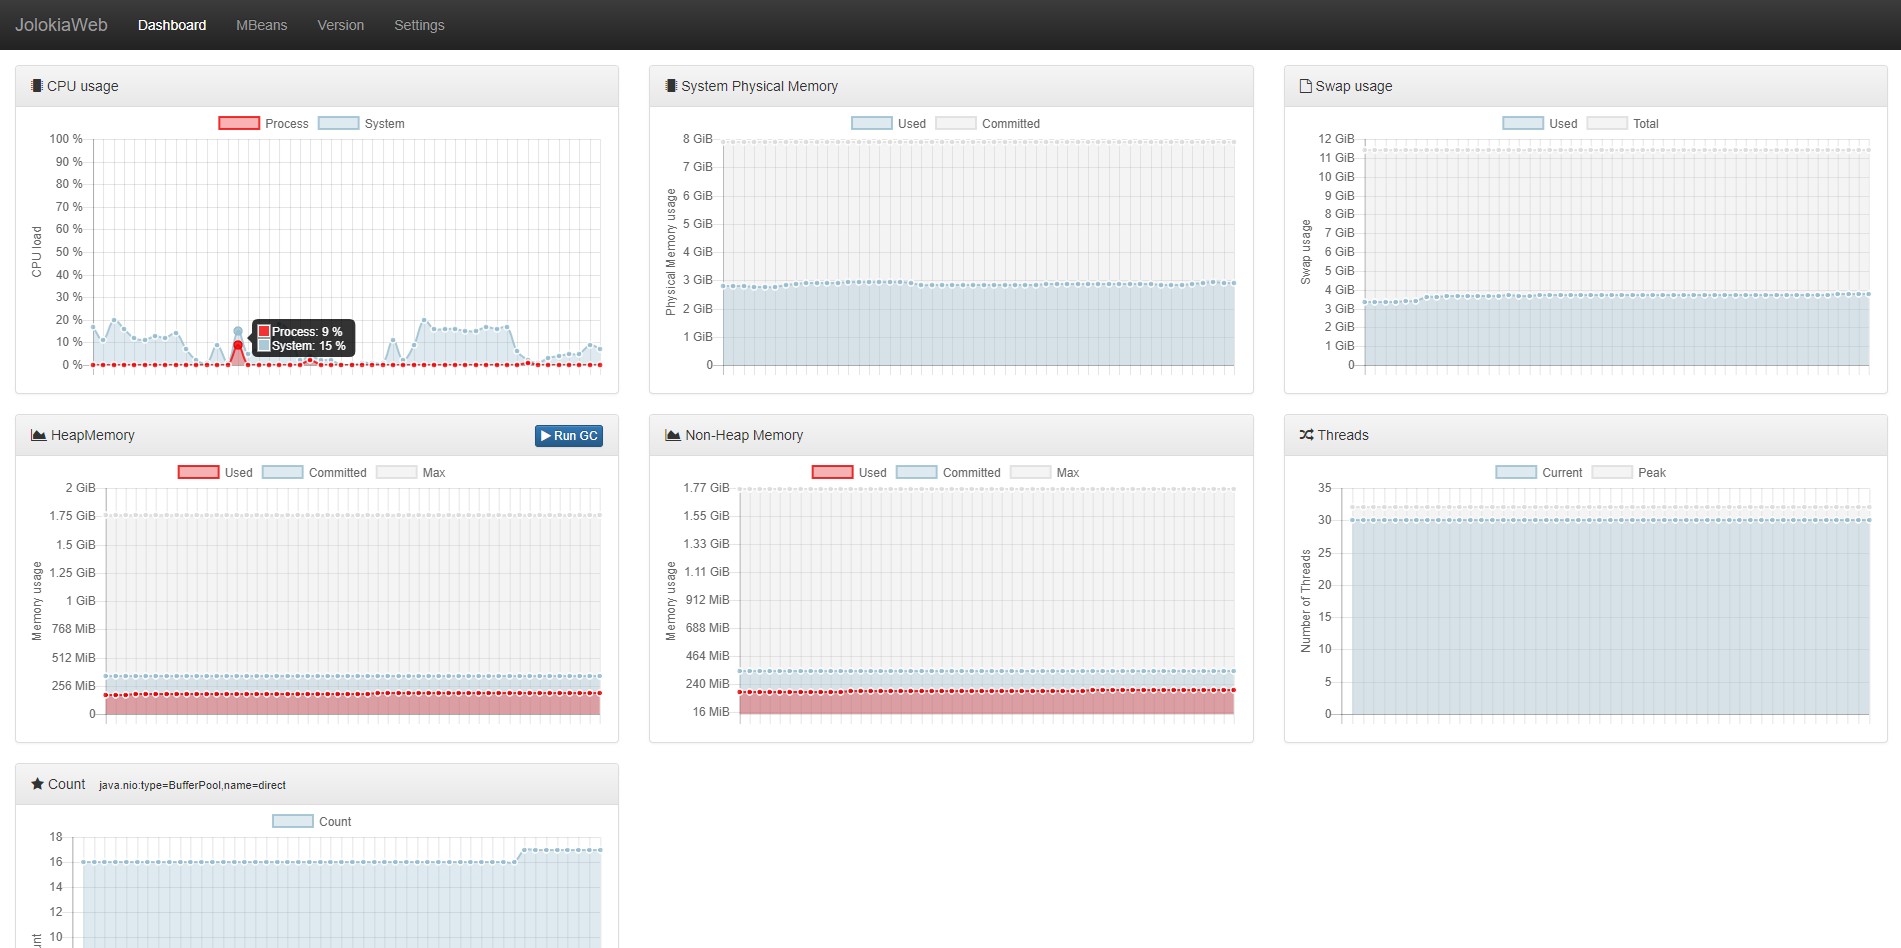
Jolokia is a substitute for JSR-160 connectors and a JMX-HTTP link bridge. It is a remote Java Monitoring Extension with JSON over HTTP. Since Jolokia has an agent-based approach, it has support for many platforms.
Apart from the everyday JMX operations, Jolokia also supplements remote JMX with standout features like bulk requests and well-polished security features. Moreover, the tool is simple, fast, and multilingual with many other uncommon features.
The JSR-160 connector allows Jolokia to connect directly with Jconsole and another JSR-160 compliant tool. It also allows you to communicate with a Kubernetes cluster directly.
One of the most significant demerits of the Jolokia JMX Monitoring Tool is that the tool does not have a GUI. However, a JAR file classification can be installed as an agent by including the JAR agent in the classpath.
Pros:
- Completely free tool
- Easy and lightweight installation
- Is highly flexible
Cons:
- Only runs on Linux
- No GUI
Website Link: https://jolokia.org/
4. Zabbix
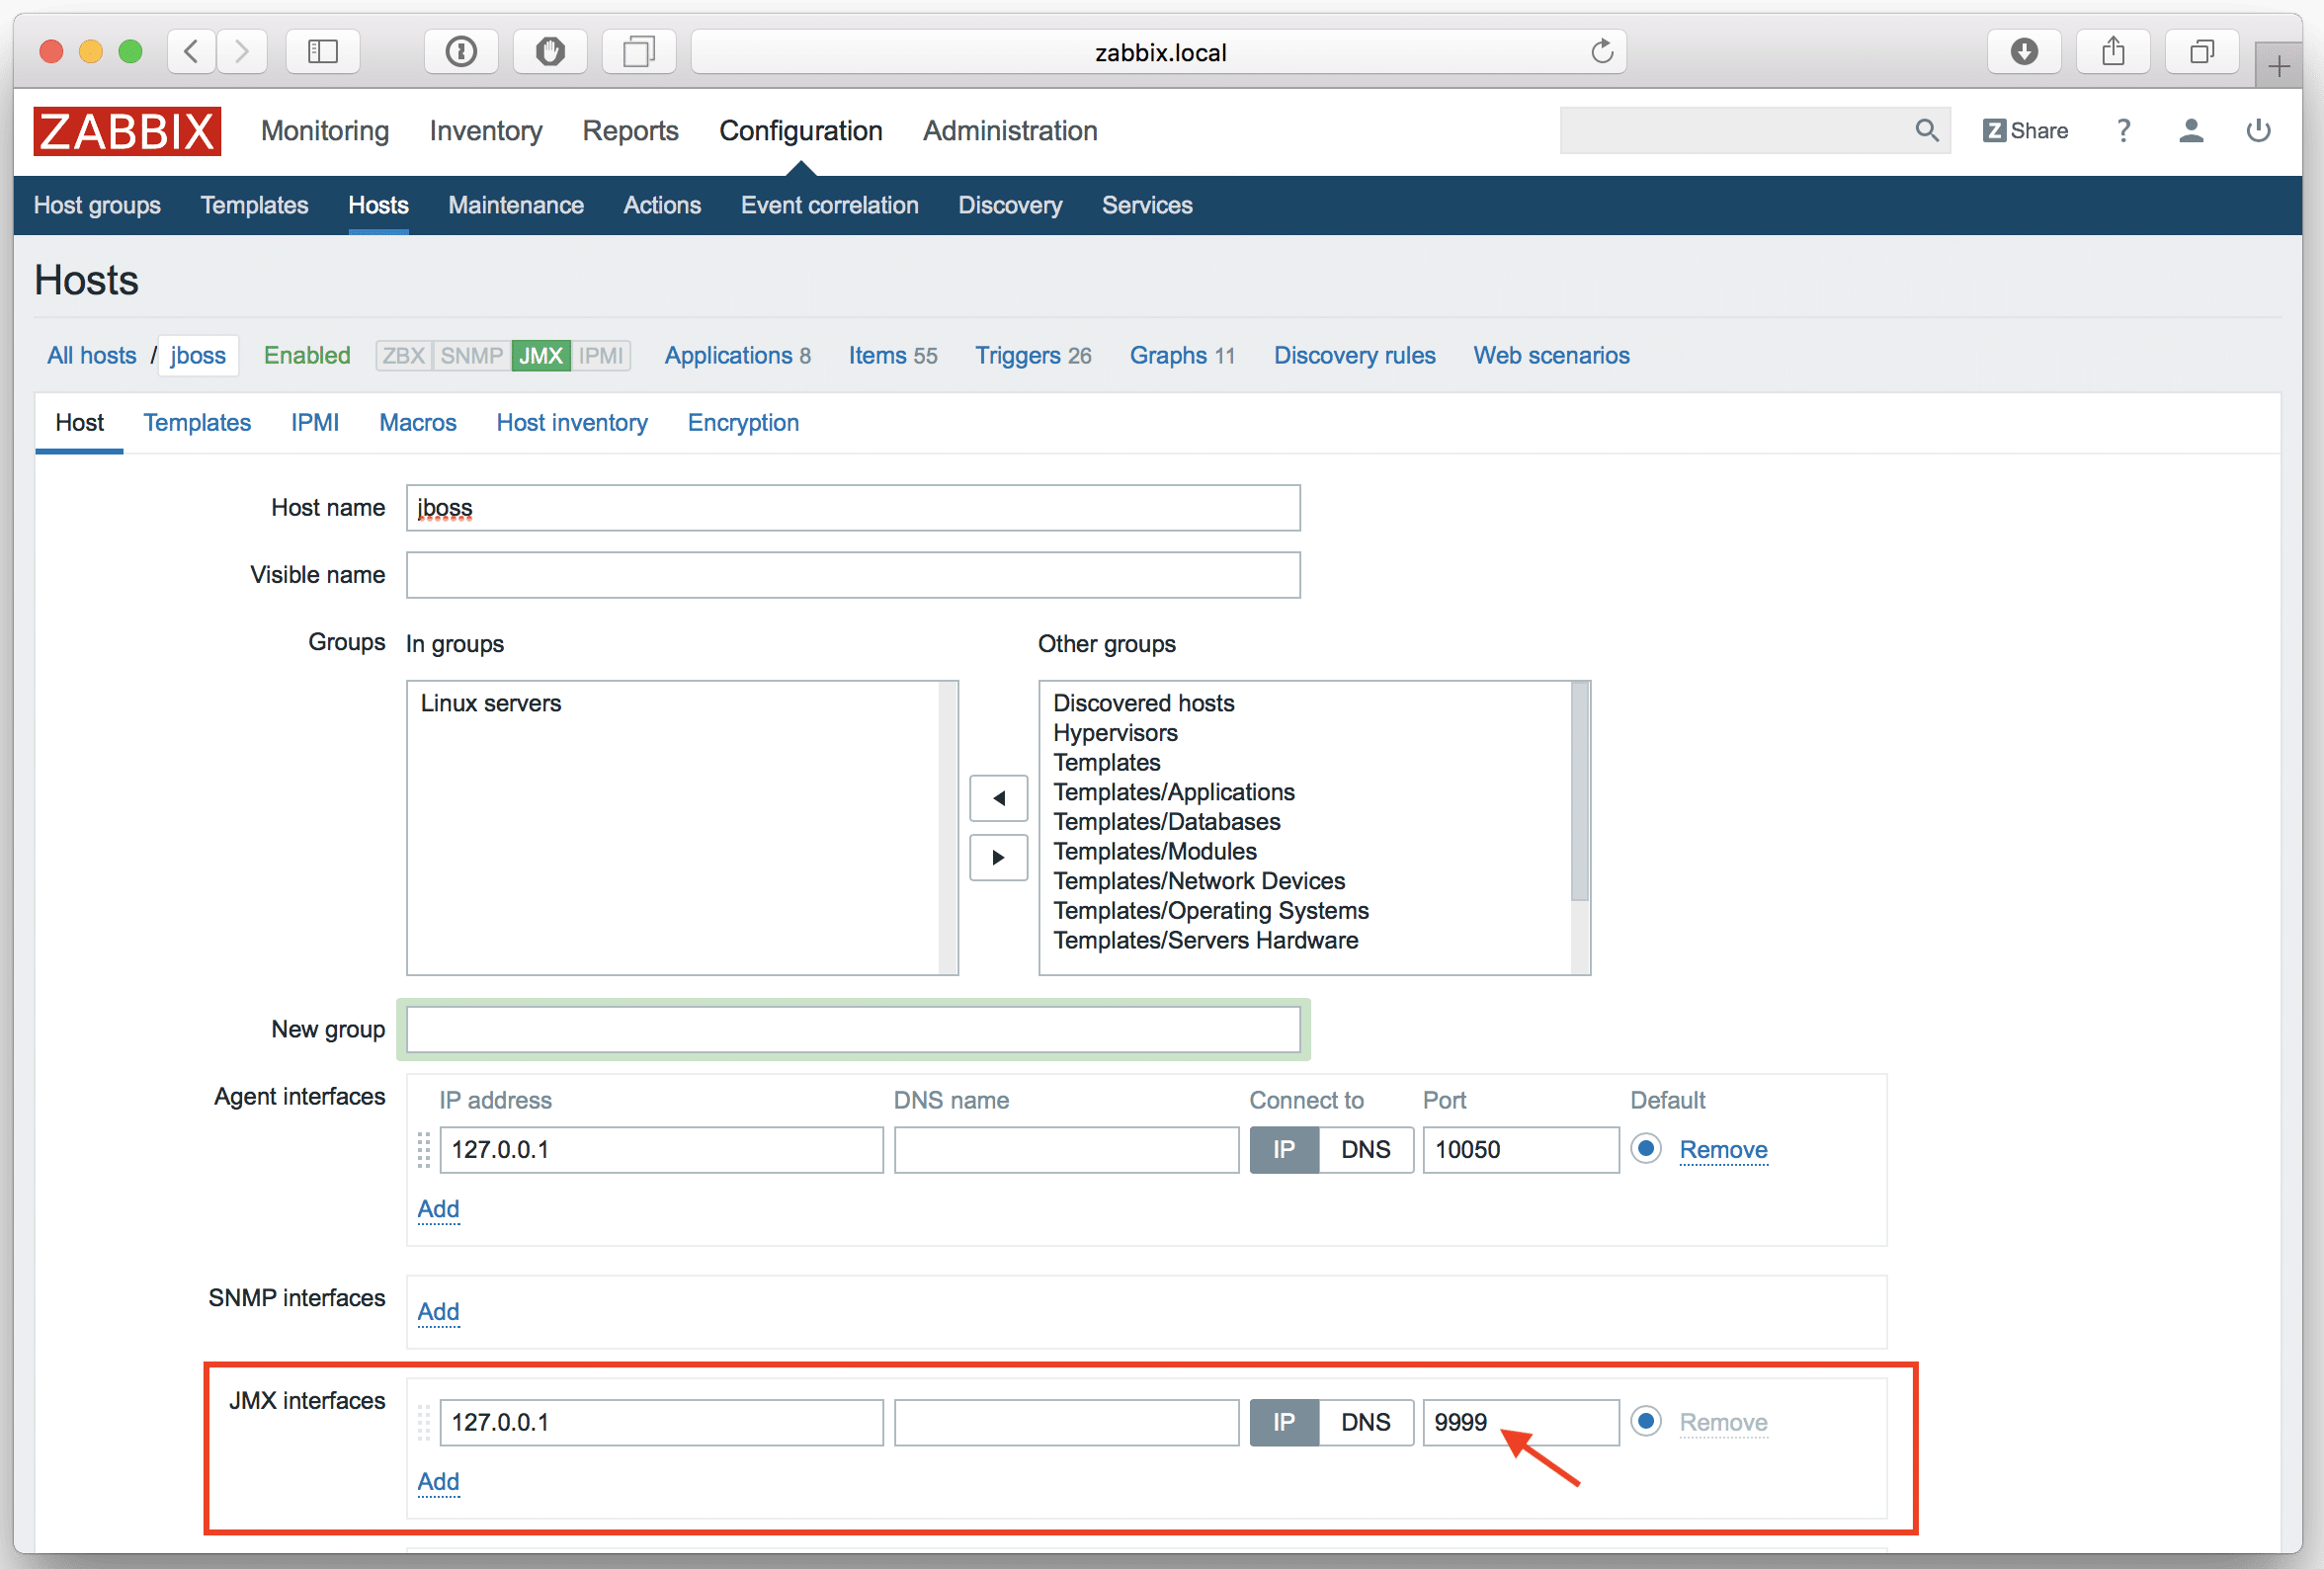
Zabbix is a Java gateway that can redeem data through JMX. It is not a bollard process that is within the Zabbix server. When assessing the performance of a Java application, the Zabbix server initiates its own Zabbix JavaPollers process to get connected with Zabbix JavaGateway and collect the data.
The main points of configuring Zabbix Java Monitoring Tools are allowing the Zabbix server to connect with Zabbix JavaGateway, configuring Zabbix JavaGateway, and Tomcat to start Java Virtual Machine remote monitoring capabilities.
Pros:
- Open-source transparent tool
- Uses both SNMP and ICMP for a broader monitoring range
- Can detect new devices and configuration changes immediately
- Offers useful templates for quick insights
- Robust notification system supports SMS, email, custom script, and webhook
Cons:
- Can take time to fully explore all features
Website Link: https://www.zabbix.com/integrations/java_monitoring
5. Hawt.io
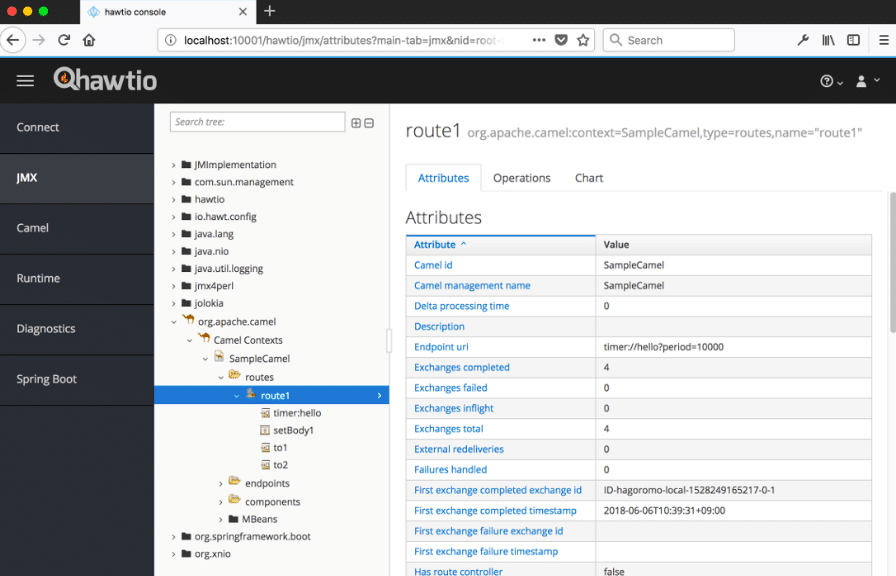
This JMX Monitoring Tool is a scalable web console that manages Java applications and is very accurate. Hawt.io works flawlessly with any application, be it WebSphere, Tomcat, WebLogic, Liberty, or others. It is constructed on top of Jolokia, and naturally, the tool supports the API endpoints of Jolokia. You can get a graphical user interface and API endpoints in a singular JAR file.
Pros:
- Simple and easy-to-use tool
- Runs via web console making it highly flexible
- Supports GUI as well as API for management
Cons:
- Not the best option for larger enterprises
Website Link: https://hawt.io/
6. Nagios
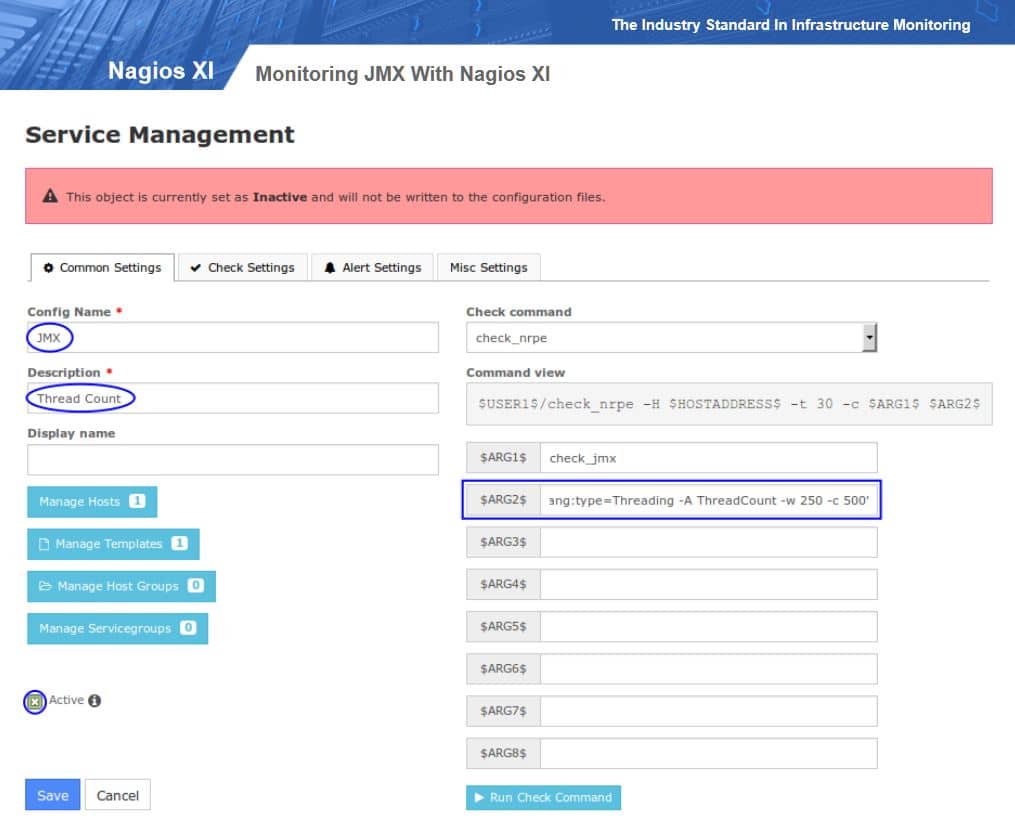
Nagios offers comprehensive monitoring of Java Management Extensions (JMX). Implementing Nagios helps in growing server, services, and application availability. The JMX monitoring device additionally helps with the quick detection of community outages and protocol failures, and it additionally helps in detecting failed procedure offerings and batch jobs.
Nagios XI and Nagios Core solutions grant JMX monitoring several abilities and heaps of benefits.
Nagios XI is the most solid and relied-on infrastructure monitoring device on the market. Millions of customers and many companies, ranging from Fortune five hundred to small enterprise owners, count on Nagios XI to get the job done. It has an effective GUI that customizes layout, design, and liking on a per-user basis, giving your clients and group contributors the flexibility they want.
A Consolidated web-based configuration interface lets admins hand out the management of monitoring configuration, gadget settings, and extra to end-users and group participants quickly. Configuration wizards inform customers via monitoring new devices, services, and functions without recognizing complicated monitoring concepts.
Nagios Core gives monitoring of all mission-critical infrastructure components. You get the entire centralized view of your complete IT operations and evaluate distinctive statistics via the internet interface. In addition, event handlers can intuitively restart failed applications, servers, devices, and offerings when issues are found.
Pros:
- Open-source transparent tool
- Simple, yet informative interface
- Flexible alerting options support SMS and email
- Robust API backend makes it a great option for developers who want to integrate their own custom applications
Cons:
- The open-source version lacks quality support found in paid products
- Installation can be technical and complex
Nagios Core allows several APIs integrations with in-house/third-party functions and community-developed add-ons. For example, the available statistics in the device make sure that SLAs are met, and historic reviews provide data of quintessential information. Additionally, you can configure multi-user accessibility and user-specific views to make certain consumers see detailed information.
Website Link: https://www.nagios.com/solutions/java-monitoring/
7. AppDynamics
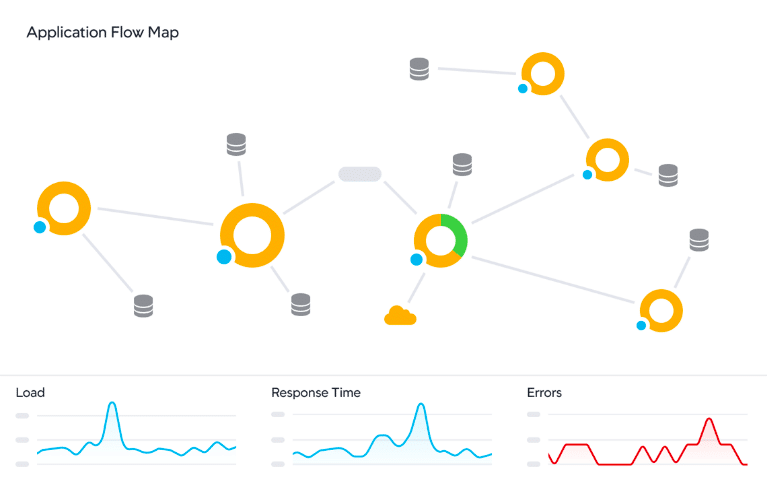
AppDynamics assists you with JMX checking by raising a query for the most helpful JMX metrics right out of the container to guarantee you can track the shared resources that can affect application performance.
AppDynamics tracks custom MBeans and inquiries and reports any MBean from the application during JMX checking to acquire ongoing clarity of custom metrics that you might have carried out as a component of your application arrangement.
The monitoring tool drills into the database connectivity pool bottlenecks by exploring how often the application utilizes and uses database associations relative to the pool boundaries upheld by the JVM container arrangement.
The JMX tracking tool also recognizes which business activities, classes, and techniques use JVM assets, such as string and database association pools.
AppDynamics allows a client to pattern and associate metrics from the connected Cassandra cluster when a sluggish business deal is executed. This degree of Cassandra tracking assists the client with understanding the condition the Cassandra bunch was in, alongside the actual events and pending tasks. You can likewise track thread pool usage and Column Family action, so the client can investigate what is affecting query execution.
AppDynamics additionally permits you to picture and map JVM dependencies, naturally finding and planning all levels that assist and cooperate with your Java Application and JVM. This gives you a far predominant perspective on your application execution than other Java performance tools.
AppDynamics platform endorses all everyday Java monitoring applications, including Tomcat, JBoss, Weblogic, WildFly, Glassfish, Apache CXF, Jetty, and some more.
Pros:
- Tailored for large-scale enterprise use
- Excellent dependency mapping and visualizations to help troubleshoot complex application systems
- Leverages AI and machine learning to provide root cause analysis and remediation steps
- Includes a free version
Cons:
- Would benefit from a longer 30-day trial period
Regarding JMX trending, you can get a detailed metrics tracker that permits you to connect, create patterns, and break down key measurements from your JVM and Container (through JMX). You can likewise get metrics through custom MBeans and identify and investigate memory slippages and article garbage issues significantly under production load.
Website Link: https://www.appdynamics.com/supported-technologies/java
JMX Monitoring Tools FAQs
What is JMX monitoring?
JMX monitoring is a process of using JMX technology to monitor and manage Java applications and their resources, such as memory usage, CPU utilization, and thread count.
What are JMX monitoring tools?
JMX monitoring tools are software tools that provide a graphical interface for monitoring and managing Java applications and their resources. These tools enable developers and administrators to view real-time performance metrics and diagnose issues.
What are some popular JMX monitoring tools?
Some popular JMX monitoring tools include JConsole, VisualVM, JProfiler, and Java Mission Control.
What kind of data can be monitored using JMX?
JMX can be used to monitor a wide range of data, including memory usage, CPU utilization, thread count, garbage collection statistics, database connections, and more.
What are some common issues that can be diagnosed using JMX monitoring?
JMX monitoring can be used to diagnose a wide range of issues, such as memory leaks, high CPU utilization, thread contention, database connection issues, and more.

