

Apache Cassandra is a widely used NoSQL database that is known for its scalability, high availability, and fault tolerance. However, with its distributed architecture and complex configuration, monitoring Cassandra can be a challenging task for administrators. That's why many organizations turn to Cassandra monitoring tools to help them monitor their Cassandra clusters and detect issues before they turn into critical problems.
Here is our list of the best Cassandra monitoring tools:
- ManageEngine Applications Manager – FREE TRIAL This comprehensive tool supports the performance monitoring and administration of all nodes in your Cassandra cluster. It even collects key metrics for thorough insights. Start a 30-day free trial.
- Site24x7 – FREE TRIAL A monitoring service that can be extended with plug-ins for specific technologies, including one for Cassandra monitoring. Start a 30-day free trial.
- ManageEngine OpManager Nexus – FREE TRIAL A database monitoring tool that supports NoSQL databases like Cassandra. It offers deep and real-time visibility into the health and performance of these databases. Start a 30-day free trial.
- Datadog Apache Cassandra Monitor This robust monitoring system collects, aggregates, and visualizes the different Cassandra metrics and sends alerts when required.
- AxonOps – Free Version This cloud-native solution can monitor, maintain, and back up any Cassandra cluster while providing the insights you need with its comprehensive dashboards.
- Sematext Apache Cassandra Monitoring This advanced tool provides real-time visibility into the metrics, logs, and events of Cassandra.
In this article, we'll explore some of the best Cassandra monitoring tools available today, and highlight their features and benefits to help you make an informed decision about which one is right for your organization.
Let's take a detailed look at each of these tools.
Our methodology for selecting the best Cassandra monitoring tool:
We've broken down our analysis for you based on these key criteria:
- Real-time monitoring capability to promptly identify and address issues.
- Detailed insights into Cassandra clusters, including health, performance, and memory usage.
- Capability to manage multiple clusters efficiently and intuitively.
- Alert systems for immediate notification of performance degradation.
- User-friendly interface for easy navigation and data interpretation.
The Best Cassandra Monitoring Tools
1. ManageEngine Applications Manager – FREE TRIAL
ManageEngine Applications Manager comes with a feature called Cassandra Cluster Management. With this feature, you can understand the performance of your Casandra clusters and troubleshoot them. At the same time, you can also plan the overall capacity to better manage your data.
Key Features
Read on to know how you can use Applications Manager to monitor your Cassandra clusters.
- Efficient Management of Clusters With Applications Manager, you can continuously monitor the different Cassandra clusters. In particular, the Applications Manager has a user-friendly dashboard that displays the health, availability, and performance status of all the Cassandra clusters. At a glance, you can tell which clusters are having problems and can drill down into their metrics to understand the root cause and troubleshoot them.
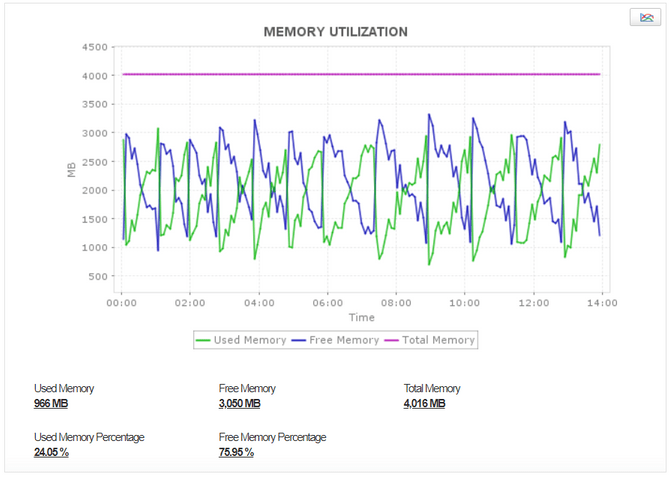
- Memory Monitoring Cassandra clusters are known to consume high levels of memory, and this can impact the overall performance of your systems, especially if you're low on RAM. This is why the Applications Manager closely follows the memory consumption patterns of different Cassandra clusters, so you can take the necessary action to free up your memory.
- Checks Performance Applications Manager tracks some key Cassandra metrics, like CPU utilization and the number of processors. This information is combined with the performance of your underlying hardware to provide direction for troubleshooting. Similarly, it monitors disk space usage over defined periods to help identify performance issues and remedy them.
- Dropped Messages Dropped messages are a sure sign of performance degradation, which is why the Applications Manager keeps tabs on them. Specifically, it sends a log summary of dropped messages along with the type of message. You can use this information for capacity planning and configuring alarms.
All the above features come together to provide a comprehensive view of Cassandra's health and performance, so you can take remedial action right away.

Why do we recommend it?
ManageEngine Applications Manager is recommended for its comprehensive monitoring capabilities, offering efficient cluster management and detailed insights into Cassandra's performance. It's particularly useful for its memory monitoring feature, crucial in managing Cassandra's high memory consumption.
ManageEngine Applications Manager offers a comprehensive solution for managing and monitoring Cassandra clusters. It stands out with its efficient cluster management, offering a user-friendly dashboard that displays the health, availability, and performance of all Cassandra clusters.
The tool's memory monitoring feature is crucial for Cassandra's high memory usage, providing valuable insights for optimizing system performance. Additionally, its performance checks, including CPU utilization and disk space usage, help in troubleshooting and ensuring the smooth running of Cassandra environments. The capacity to track dropped messages further aids in capacity planning and alarm configuration.
Who is it recommended for?
Ideal for organizations seeking a tool to continuously monitor multiple Cassandra clusters with a focus on performance, health, and memory utilization.
Pros:
- Continuous monitoring of multiple clusters.
- User-friendly dashboard for easy health and performance assessment.
- Detailed memory consumption tracking.
- Monitoring of key Cassandra metrics like CPU utilization and disk space.
Cons:
- May be complex for users new to cluster management tools.
Register to get a quote. In the meantime, you can also download a 30-day free trial.
2. Site24x7 – FREE TRIAL
Site24x7 does not limit buyers to the standard functions in its main package. The platform can be expanded through a plug-in library, and one of those extensions adds monitoring for Apache Cassandra. Once activated, that capability operates within the rest of the service, so Cassandra oversight sits alongside the platform’s existing monitoring for networks, servers, and applications rather than being handled through a separate tool.
Key Features
Here are the most significant features of the Site24x7 Apache Cassandra monitoring service:
- Live Monitoring: The service follows Apache Cassandra clusters continuously, giving administrators real-time visibility into their condition and performance. This is especially important in larger environments where Cassandra’s scale and high-availability design still require close supervision to keep the system operating efficiently.
- Vital Performance Tracking: The platform reports metrics such as read and write latency, disk utilization, memory consumption, and node status. These measurements help administrators detect resource strain, bottlenecks, and hardware faults before they interrupt operations, while also supporting better tuning and resource planning.
- Multi-Level Activity Tracking: Multiple clusters and individual nodes can be observed from one console, which makes it easier to detect problems at node level before they affect the wider database environment.
- Transaction Monitoring: Cassandra-specific indicators, including commit log size, cache hit ratio, and request latency, are collected and displayed through dashboards that help support teams isolate issues and respond more quickly.

Why do we recommend it?
Site24x7 is recommended because automation sits at the core of its monitoring model. Site24x7 removes the need for technicians to watch every system manually at all times by using alerts, while tracking activity across the full delivery stack in parallel. When performance issues surface, Site24x7 helps support teams identify the point of failure more quickly. That improves operational efficiency and lowers the risk of problems passing unnoticed.
Who is it recommended for?
The package suits businesses of different sizes because the plans are expandable and the entry-level editions are priced for very small organizations. The plug-in structure also makes the platform more adaptable, since buyers can enable technologies such as Cassandra only when they are relevant to their own environment. Core services remain present by default, while extra monitoring functions are added selectively to match actual system requirements.
Pros:
- Free add-on available for Cassandra monitoring
- Threshold-based alerts can be configured for Cassandra performance
- Helps detect high latency and low disk space
Cons:
- Only available as a cloud-based service
Site24x7 is delivered as a SaaS platform with several plans. Each edition includes the same functional modules, and the main difference between them is the capacity allowance attached to each service area. The lowest-priced option is the Infrastructure Monitoring edition, which starts at $9 per month. A 30-day free trial is available for Site24x7.
3. ManageEngine OpManager Nexus – FREE TRIAL

ManageEngine OpManager Nexus, formerly OpManager Plus, is an enterprise monitoring tool that covers all components, including NoSQL databases like Cassandra. It offers deep visibility into the health, query performance, and resource usage of databases, so you can troubleshoot issues early.
Key Features:
- Extensive KPIs: Tracks a wide range of KPIs like CPU, memory, I/O metrics, sessions, connections, and cache efficiency for comprehensive insights.
- Slow Queries: Identifies slow queries that can take a long time to execute, thereby consuming your resources.
- Database Deviations: Detects deviations using static and dynamic thresholds.
- Alerts: Sends instant alerts through multiple channels, like email, SMS, and Slack.
- Remediation: Supports automated workflows to remediate basic issues.
Why do we recommend it?
OpManager Nexus is an essential tool to help you stay on top of the performance of your Cassandra databases. Given their criticality to your operations, you can use the correlations and analysis generated by OpManager Nexus to plan well and make informed decisions, instead of handling emergency responses.
What we love about this tool is its depth and breadth of coverage. It can track almost any metric related to database health and can correlate them to provide accurate information about issues and their root causes. With such information, you can proactively fix issues before they impact operations.

Who is it recommended for?
It is a good choice for organizations that use multiple databases in their environment. It also works well for database designers and engineers who are responsible for maintaining the high performance and security of these databases.
Pros:
- Uses ML-based forecasts to accurately pinpoint issues.
- Generates scheduled and on-demand reports.
- Reduce alert noise and fatigue.
- Analyzes cache efficiency
Cons:
- Initial setup may require help.
OpManager Nexus’ Professional edition starts at $1,233 for 50 devices, while the Enterprise edition is priced at $ 19,995 per year for 1000 devices. Start a 30-day free trial.
4. Datadog Apache Cassandra Monitor
Datadog is a robust monitoring solution that gathers key metrics from your Cassandra clusters and analyzes them for deviations or anomalies. Accordingly, it sends alerts based on the notification configuration.
Key Features
Here's a look at some key features of Datadog Apache Cassandra Monitor.
- Comprehensive Dashboard Datadog's comprehensive dashboard graphs the metrics of Cassandra with other metrics to give a unified picture of the state of your systems. There are a ton of things you can do on this dashboard and with all the insights it generates. For example, you can get information on the total latency of Cassandra instead of the recent ones to get a better idea of the trends over time. Likewise, you can monitor the overall read latency as well. Such metrics provide the right insights into the state of your Cassandra and the data stored in it.
- Themed Dashboards Themed dashboards are a unique feature that allows you to get information on specific themes or perspectives, like the performance of read or write actions in Cassandra. Undoubtedly, it provides insights into Cassandra's internal workings while helping you improve efficiency and troubleshooting.
- Sends Alerts Datadog not only converts the raw data coming from Cassandra but also monitors it. Essentially, it checks the values of certain important metrics against the established baseline values. In cases of deviations, Datadog sends an alert to your system. It checks your notification configurations and sends alerts accordingly.
- Variety Range of Devices With Datadog, you're not limited by the type of device. Instead, you can use it to monitor individual hosts, services, processes, metrics, and their different combinations to get a unified view of how your system is faring and what you can do to get more out of it.

Why do we recommend it?
Datadog is a robust tool that provides comprehensive and thematic dashboard insights into Cassandra's performance, making it a valuable tool for detailed analytics and alert management.
Who is it recommended for?
Ideal for organizations that require in-depth analysis and monitoring of Cassandra clusters across various devices and services.
Pros:
- Unified dashboard for comprehensive metric analysis.
- Thematic dashboards for specific performance insights.
- Effective alert system based on deviation from baseline metrics.
Cons:
- Pricing can be complex due to its customizable nature.
Datadog has a highly flexible pricing structure where you pay only for the features you use. Check out the customizable pricing here.
You can also start a free trial.
5. AxonOps

AxonOps is a cloud-native solution that comes with a ton of features to monitor, maintain, and back up any Cassandra cluster. With this tool, you can stay on top of the health and performance of your Cassandra clusters from anywhere.
Key Features
Below are some salient features of AxonOps.
- Intuitive Dashboards One of the highlights of AxonOps is its intuitive dashboard, which provides all the information you want in a single place. With this dashboard, you can get a snapshot of different metrics related to your cache, coordinator, applications, and more. Also, you can drill down on each metric to understand the deviations and the current values when compared with historical ones, as well as other pertinent information that can point you to the root cause of the issue.
- Logs and Events This feature collects logs and other internal Cassandra events, like JMX calls. Eventually, it displays all the collected information in a visually appealing way to help you understand the connections between events. Such correlation can make it easy to detect anomalies and their causes.
- Service Checks The RAG status dashboard regularly checks your nodes and services. In particular, it evaluates your open ports, processes, and service health with minimum setup. All this information can help you detect faulty ports and poorly performing services, so you can address them right away.
- Alert Integrations Another cool feature of AxonOps is that you can set the alert rules and configure their criticality. Also, you can route alerts to Slack, PagerDuty, and even generic webhooks. It's even possible to configure a specific route for each alert.
- Cassandra Repairs Repairs are one of the most difficult operations and one that has a steep learning curve. At the same time, it's essential for maintaining the integrity of your data clusters. AxonOps eases this process with its Adaptive Repair feature, which will constantly monitor the performance of your cluster and regulate the speed of the repair process. When needed, it can even throttle the process during busy times.
- Backup and Restore Another highlight of AxonOps is its backup and restore capabilities. With this tool, you can specify your backup schedules, work with target storage providers, and even manage retention for local and remote storage.
In all, AxonOps is specifically designed for monitoring Cassandra, and its many features ensure that your Cassandra has high uptimes and excellent performance.

Why do we recommend it?
AxonOps is a cloud-native solution that excels in monitoring, maintaining, and backing up Cassandra clusters. Its intuitive dashboards and comprehensive alert integrations make it a standout choice for real-time Cassandra monitoring.
Who is it recommended for?
Best suited for businesses needing a detailed, cloud-native monitoring solution with adaptive repair features and backup capabilities for Cassandra clusters.
Pros:
- Efficient log and event collection for anomaly detection.
- Regular service checks for node and service health.
- Advanced alert integration with platforms like Slack and PagerDuty.
Cons:
- May require a learning curve to fully utilize advanced features.
You can get access to the free developer version sandbox environment. You will need to register and obtain a customized quote for enterprise scale service.
6. Sematext Apache Cassandra Monitoring
Sematext is a reliable and extensible tool that provides real-time visibility into your Cassandra database's metrics, logs, and events in real-time.
Key Features
Let's now jump into Sematext's Cassandra monitoring features.
- Detects Performance Issues Sematext is a comprehensive monitoring solution that gathers all the metrics and logs in one place to provide a comprehensive view of the health and performance of your Cassandra clusters. With this unified information, you can spot the slow nodes that are leading to performance degradation, get alerts on slow read and write performance, and track long-pending or failed cluster operations. Also, you can drill down to each metric to understand the cause of its performance degradation.
- Tracks Metrics in Real Time Sematext correlates JVM metrics and JVM garbage collection logs to provide in-depth insights into the performance of your Cassandra clusters. More importantly, you get the metrics in real-time, so troubleshooting can be faster.
- Customizable Dashboards With Sematext, you get out-of-the-box dashboards to continuously monitor your Cassandra database performance. In these dashboards, you can quickly add or remove any component, combine different metrics, change views, and so much more.
- Generates Notifications You can configure notifications to meet your organization's operations and teams' preferences. In particular, you can set up anomaly detection or threshold alerts based on your baseline values. Also, you can customize notifications and send them via Slack, PagerDuty, email, etc. Moreover, there's no limit on the number of members who can receive notifications, and at the same time, you can provide role-based access to these notifications as well.

Why do we recommend it?
Sematext provides real-time visibility into Cassandra's metrics, logs, and events, making it a powerful tool for detecting performance issues and managing database health.
Who is it recommended for?
Best for businesses that need real-time, in-depth monitoring with customizable dashboards and extensive notification options for their Cassandra databases.
Pros:
- Comprehensive real-time tracking of performance issues.
- Customizable dashboards for tailored monitoring.
- Extensive notification options, including Slack and PagerDuty integration.
Cons:
- May require technical expertise to set up and customize effectively.
In all, Sematext's Cassandra monitoring tool is designed to provide real-time monitoring and management of Cassandra databases. It offers in-depth monitoring of various Cassandra metrics that helps you improve the performance, availability, and uptime of your Cassandra databases.
Bottom line
In conclusion, monitoring tools are essential for ensuring the optimal performance of a Cassandra database. The tools mentioned in this article – ManageEngine Applications Manager, AxonOps, Datadog, Site24X7, and Sematext – are all excellent choices for monitoring and managing the Cassandra database clusters. Each tool has its unique features, strengths, and weaknesses, and the best tool for you will depend on your specific needs and preferences. Regardless of which tool you choose, monitoring your Cassandra database regularly is crucial for maintaining its reliability, scalability, and availability. By leveraging the power of these monitoring tools, you can proactively identify issues and resolve them before they become critical problems, ensuring that your Cassandra database runs smoothly and efficiently.


