Choosing a monitoring software is an important decision as it has a profound impact on your organization's security and performance. This is why it's important to research each tool before deciding the right fit for your needs.
To ease this process, we have come up with a comparison series, where we talk about how two popular monitoring platforms stack against each other. In this article, we will be comparing Graphite with Datadog.
About Graphite

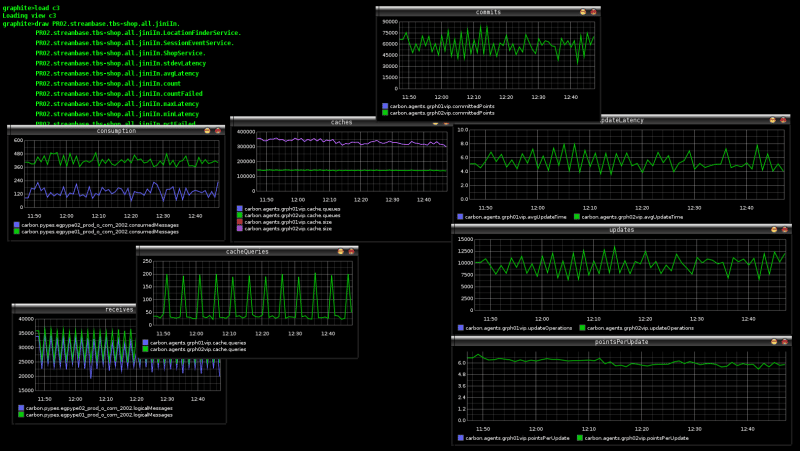
Graphite is a logging and graphing tool for monitoring time-series data. This tool provides the IT admin and operations teams the visibility they need to understand the health, behavior, and performance of its applications and devices. It offers the granular control that these teams need to identify and fix errors before they impact the wider organization. Many organizations also use Graphite to improve the performance of their resources like websites and servers, as this enterprise-ready tool works well on both cloud and on-prem infrastructure.
About Datadog

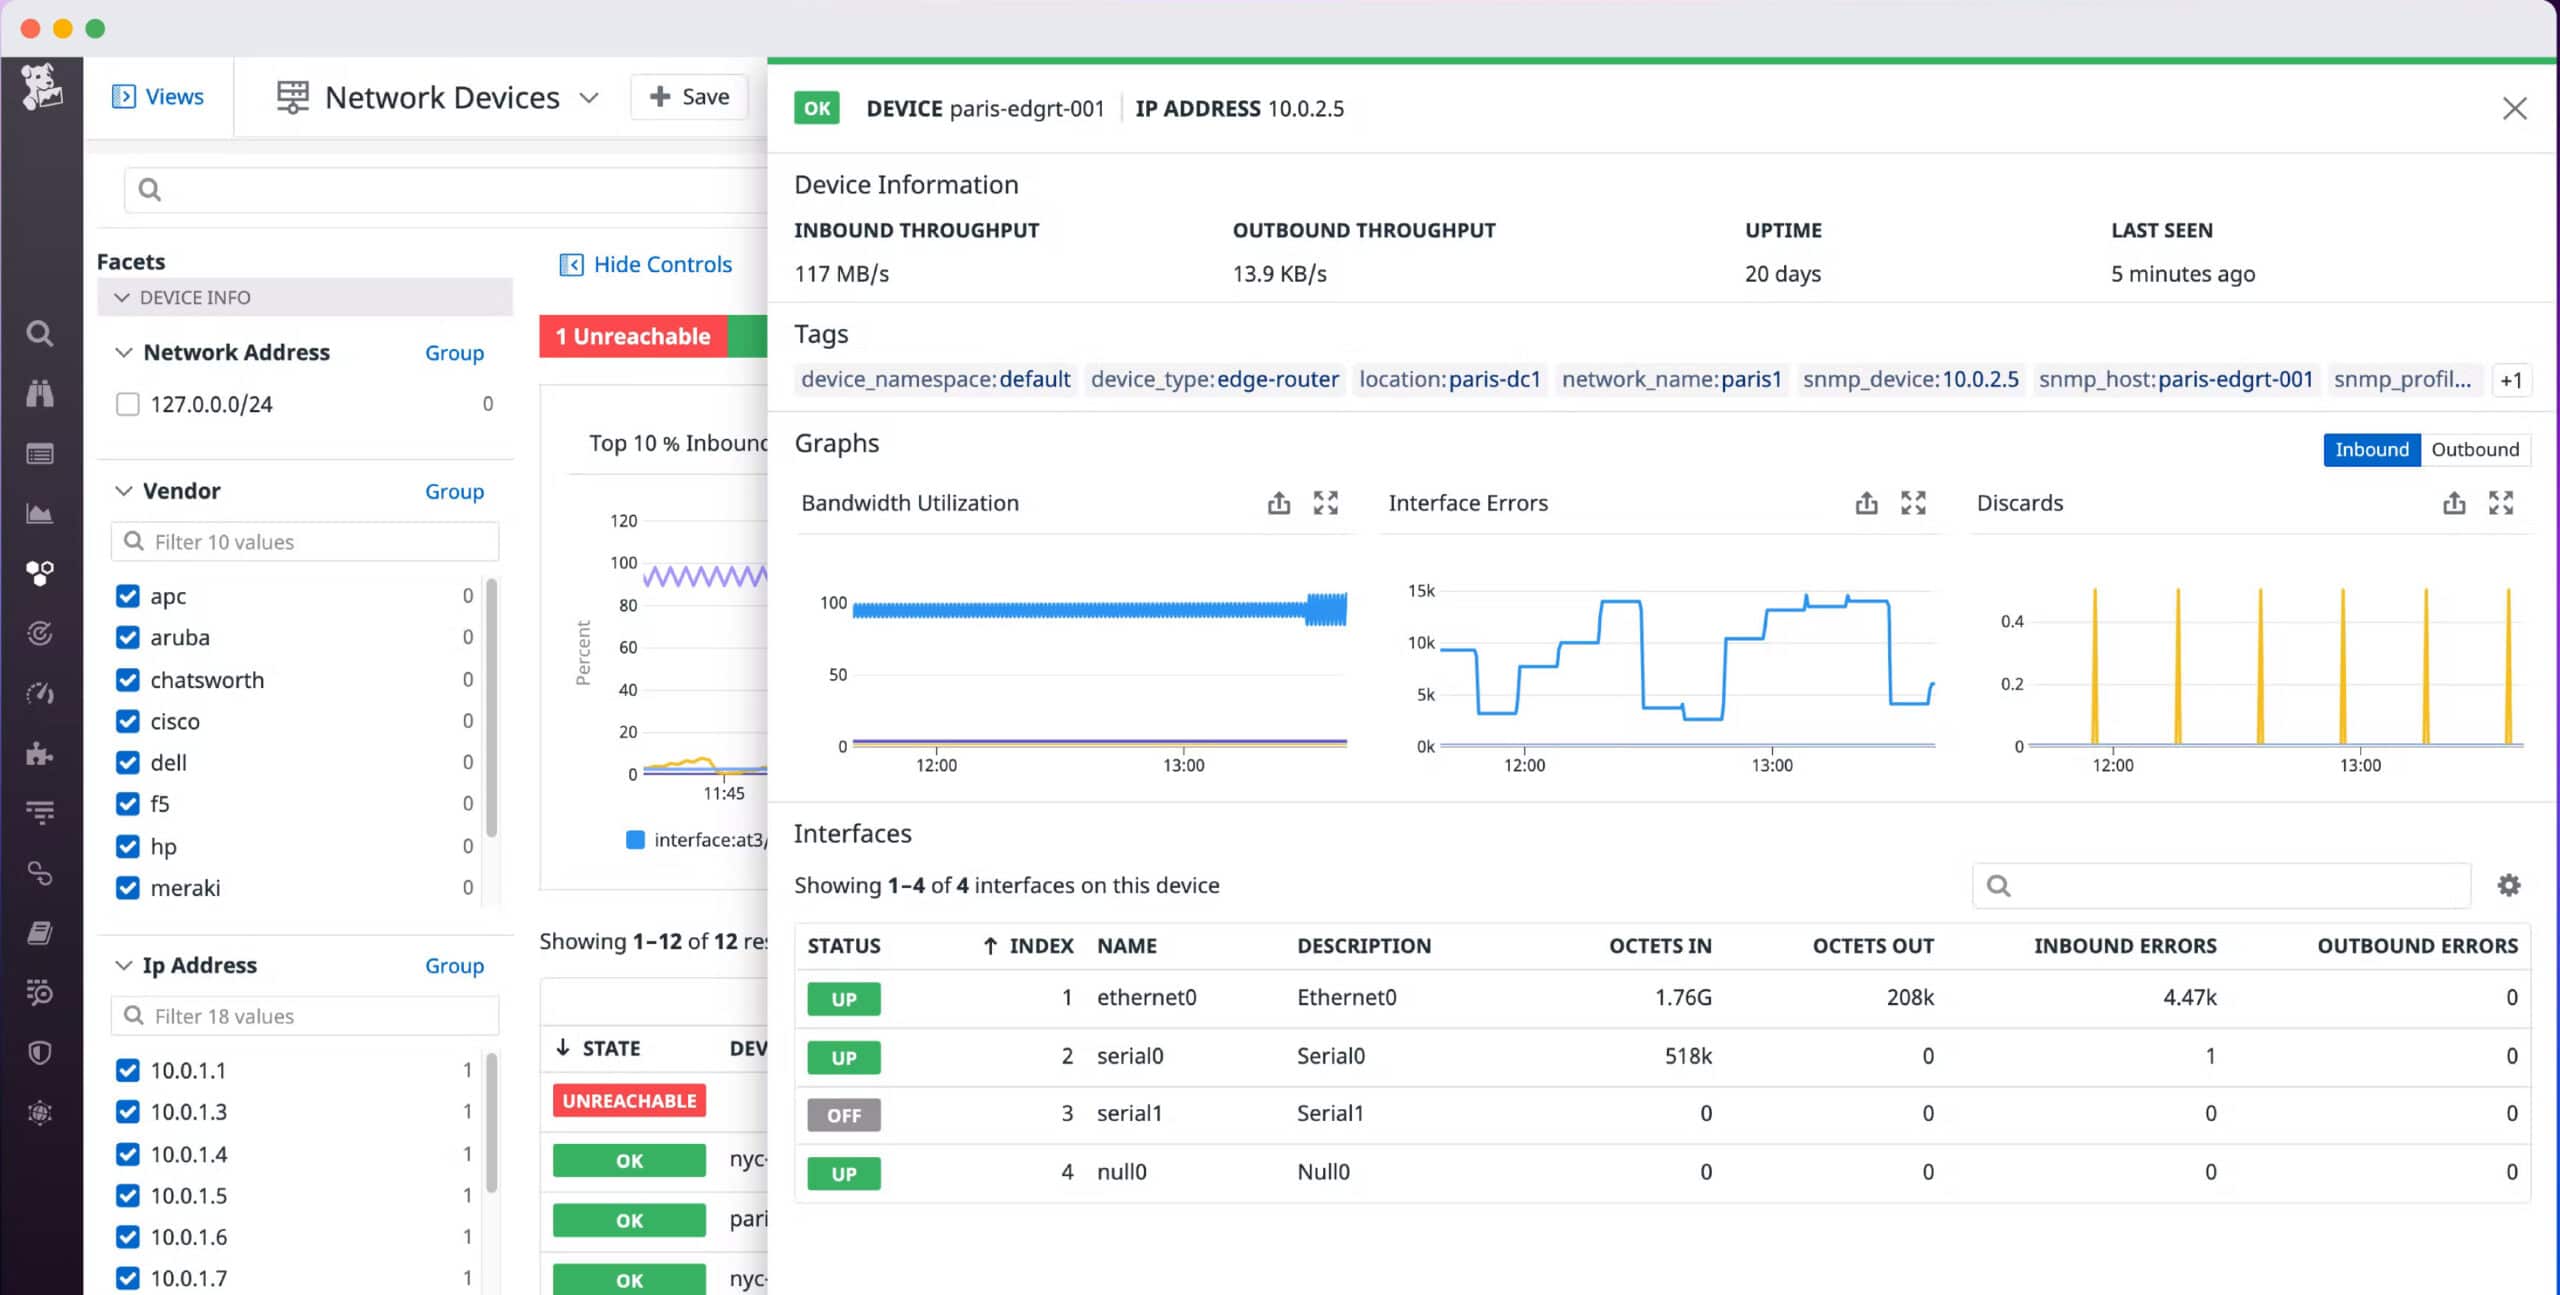
Datadog is an infrastructure and application monitoring service that continuously monitors your infrastructure. It gathers information on different metrics and evaluates the same across established benchmark values. In case of deviations, it sends alerts through the configured channels to the appropriate user. You can extend this service to a single host or the entire cluster.
Now that you have a brief idea of the two platforms, let's see how they compare against each other.
Graphite vs Datadog – A Detailed Comparison
Graphite and Datadog are vastly different in terms of capabilities and offer varying benefits to organizations. For example, Datadog is a system monitor that comprehensively monitors all the assets in your organization while Graphite is more suited for displaying time-series data. Often, organizations may use both tools together to gain varying benefits. That said, let's look at how different these tools are.
Data types
A defining feature of Graphite is that it can display any type of data, but they have to be in a time-series format. For example, you can display the hard disk performance or CPU usage, second by second in the form of a graph. Such a graph will help you identify the spikes and variations, and you can get to the root cause of the same easily.
Datadog, on the other hand, is a lot more comprehensive as it displays real-time information about different applications, modules, and devices in your network. All these metrics are displayed either in the form of graphs or charts, based on your preference. Also, the data don't have to be in a time-series format and can be represented in any way.
Flexibility in deployment
This is a key difference between the two tools. Graphite is open-source and you can download its source code from GitHub. This code works well across most common environments, both in the cloud and on-prem. You can install it on Unix, Linux, Mac OS, and even on docker containers. The makers of Graphite also have a hosted version that can be used as a cloud service.
With Datadog, you don't have such extensive versions. Rather, it is available only as a SaaS package. But that's a good choice by itself because there's considerable storage space and flexibility to deploy it anywhere. Further, you can implement the monitoring service without any hassles.
Ease of Use
Graphite comes with three components, namely, carbon, whisper, and graphite UI. Here, Carbon is the component that receives the time-series data and passes them to Whisper, the database that stores this data. Finally, the Graphite UI is the component that displays this data. Though all these three components work well with each other and are also interconnected, still you have to install them separately. This resources a certain amount of technical knowledge, time, and effort.
Datadog, on the other hand, is a single package and requires just a single install. This translates to fewer resources and technical roadblocks for deployment.
Functionality
Another key difference is that Graphite is only a data receiver that gets data from another system and displays them in a time-series format. Please note that it does not collect data from individual systems.
But Datadog is a platform that collects data from different endpoints, analyzes them against the established baseline, and alerts when there are deviations.
Automation
There's some level of automation built into both platforms, but the goals of the automation vary greatly between the two platforms.
Datadog is comprehensive when it comes to automation. It gathers data, analyzes it against thresholds, and creates alerts in case of deviations. While sending the alerts, Datadog also sends the context automatically to help the concerned person address the issue.
Graphite, on the other hand, automates the process of data receiving and displaying, as it converts the analyzed data into a graphical form to help viewers understand the patterns and changes over time.
Pricing
The last aspect we'll look into is pricing. If you choose the open-source version of Graphite, it is 100% free. But the hosted version, along with two other tools, namely, Prometheus and Grafana cost $99/month.
Datadog, on the other hand, has many pricing plans. The plan that's closely related to Graphite is the Infrastructure plan. It's free for the first five hosts. The Pro package costs $18/host when billed monthly and $15/month when billed annually, and works well for less than 100 hosts. If you have 100 or more hosts, Datadog recommends the Enterprise plan. It costs $23/month when billed annually and $27/month when billed monthly. Plus, you get a 14-day free trial with Datadog.
Graphite is the more pocket-friendly choice as it comes with other tools for a flat monthly cost. Datadog is economical if you have a varying number of devices to monitor each month, as that way you'll pay only for what you use.
Now comes the big question, which of the two is better?
Datadog vs Graphite – The Verdict
In all, Datadog and Graphite are two different tools that don't directly compete with each other. Rather, these are two platforms that can complement each other. The data gathered and analyzed by Datadog can be displayed using Graphite. In other words, you can use both tools together for better analytics and visualizations.
Conclusion
To conclude, Graphite and Datadog are often used to monitor devices to understand how they perform over a period. That said, both tools work differently. While Datadog is more comprehensive and monitors different aspects of a device, Graphite receives the data and displays them in a time-series format for easy assimilation. From this perspective, we can say that both tools are not identical, rather they complement each other.
This is why it's common for organizations to have Datadog for monitoring and analytics and Graphite for viewing this information in a time-series format. Such a combination provides a ton of benefits, as it's easy to view the performance of a device over a specific period and take the necessary action to address the problems if any.
We hope this was helpful to decide on the best fit tool for your infrastructure. Make sure to read our other detailed comparisons before you make an informed decision.


