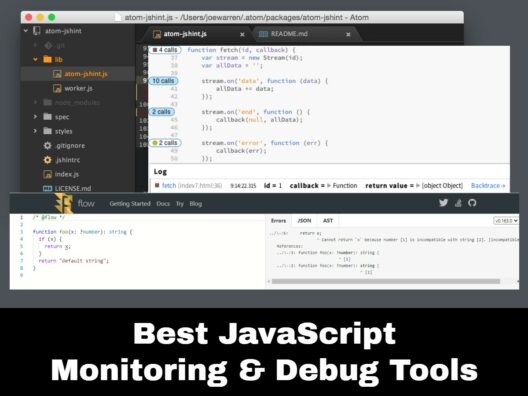
JavaScript is a popular scripting language that can be used both on the client and server sides to make web pages dynamic and interactive. This text-based language adds behavior to web pages and, in the process, improves the user experience of visitors who come to the web page.
Here is our list of the best tools for monitoring and debugging JavaScript:
- Flow This static type checker makes it easy to find bugs as you code using an advanced data flow analysis.
- Theseus This extension of Brackets code editor is a debugger for JavaScript and Chrome.
- JSHint This static code analysis tool is used to check if JavaScript code complies with the prevailing coding rules and detect errors.
- Spline Tech This JavaScript debugger and editor make it easy to edit JavaScript and VBScript code located inside HTML pages.
- Sentry.io This JavaScript performance monitoring tool resolves JavaScript errors and provides actionable insights.
- Postman This popular JavaScript debugging tool is ideal for troubleshooting requests and responses in your application.
- ESLint This linter for JavaScript is built to analyze code as you type to prevent syntax errors and typos.
- JS Bin This tool is well-suited for a collaborative debugging of your JavaScript code.
- Raygun Αn error monitoring and crashes reporting tool that makes it easy to diagnose and resolve errors.
While JavaScript is mainly used for web pages and web-based applications, it can also be extended to other areas of software development. Here are some things you can do with JavaScript.
- Makes web pages interactive. You can alter the behavior and appearance of any element on a web page when a specific event occurs. This event can be a mouse click, a mouse hover, and more.
- Enables you to display animations, play audio and video on a web page, use a drop-down menu, create a carousel of images, countdown a timer, zoom in and out.
- Ideal for creating regular features and tasks across the web and mobile applications. Many popular sites like PayPal and LinkedIn use JavaScript.
- It can be combined with Node.js to build web servers and backend infrastructure.
- Ideal for game development.
- It is the only scripting language that is native to any web browser.
Due to these reasons, JavaScript is one of the most popular scripting languages in the world today.
Since many applications today run on JavaScript, it becomes essential to have a process to monitor and debug JavaScript code to ensure the reliability and stability of applications built on JavaScript.
This monitoring and debugging are not easy manually. There’s always a possibility to oversee some critical errors, not to mention that it can consume a lot of time and effort. To ease this process, many tools automate this monitoring and debugging.
Our methodology for selecting the best JavaScript monitoring & debug tools:
- We prioritize tools that offer a comprehensive range of features such as real-time error tracking, efficient code analysis, and advanced debugging capabilities.
- Tools that seamlessly integrate with common development environments and workflows are more valuable.
- A user-friendly interface that simplifies the debugging process is crucial, especially when handling complex code.
- We consider the impact of the tool on system performance and its efficiency in identifying and resolving issues.
- A robust community and reliable support are essential, especially for troubleshooting and leveraging advanced features.
Let's now take a detailed look into the features of each of these tools.
Τhe Βest Τools for Monitoring and Debugging JavaScript
1. Flow

Flow is a static type checker for JavaScript that comes with many advanced features to quickly identify bugs, even while coding and collaborating with team members.
Key Features:
- Identifies problems in your code as you type it, thereby saving time and effort.
- Makes an effort to understand your code and accordingly provides intelligent recommendations.
- Safely refactors your code to give you the confidence to make changes to an extensive database.
- Enables collaboration by preventing bad re-bases.
- Protects your libraries from misuse and misinterpretation.
- Helps to understand the JavaScript code.
- Uses data flow analysis to infer types and, based on it, tracks your code throughout the application.
- Understands idiomatic JavaScript as well as the common Javascript patterns.
- Integrates well with many tools, so it is easy to integrate it within your existing infrastructure.
- Provides fast feedback in real-time while you code.
Why do we recommend it?
We recommend Flow for its ability to quickly identify bugs and provide intelligent code recommendations. Its real-time problem identification significantly enhances coding efficiency and collaboration.
Who is it recommended for?
Flow is ideal for JavaScript developers seeking a robust static type checker. Its features cater to those who prioritize real-time code analysis, collaboration, and extensive codebase management.
Pros:
- Simple static checker that quickly identifies bugs
- Includes library protection
- Includes autocompletion and code tracking
- Is completely free
Cons:
- The interface could use improvement
Pricing: Free
Download: Click here to try this tool and here to download the code from GitHub.
EDITOR'S CHOICE
Flow is our top choice for JavaScript monitoring and debugging. This tool excels in its ability to identify issues in real-time, offering advanced data flow analysis that enhances the coding process. Flow's intelligent recommendations and code refactoring support make it not just a debugging tool but a partner in code development. The fact that it understands idiomatic JavaScript and integrates seamlessly with various tools makes it exceptionally user-friendly.
Download: Flow Static Type Checker
OS: Cross-platform compatibility
2. Theseus
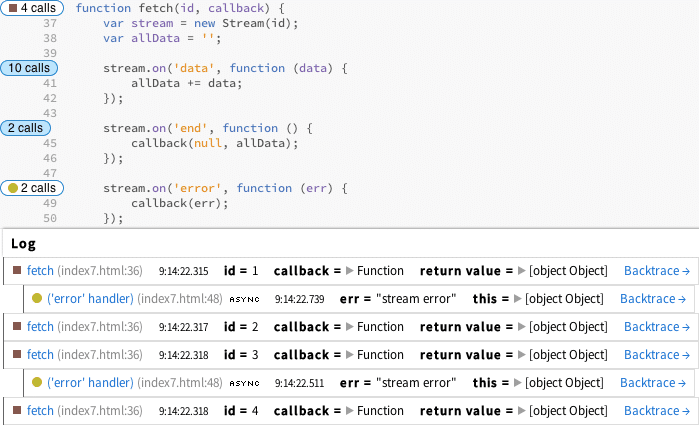
Theseus is a JavaScript debugger for JavaScript, Node.js, and Chrome. It is an extension of the Brackets code editor and was created by a collaboration between the User Design Interface Group at MIT and Adobe Research.
Key Features:
- Displays the number of times a function has been called to have a real-time understanding of each function call.
- Provides retroactive inspection of parameters, return values, and any exceptions that a function may have thrown.
- All invocations of a function are shown as a tree.
- Debugs the JavaScript functions running on Node.js and Chrome.
- It enables you to rewrite JavaScript code to trace everything that has happened.
Why do we recommend it?
Theseus stands out for its real-time function call insights and retroactive inspection capabilities, making it a powerful tool for debugging JavaScript in Node.js and Chrome.
Who is it recommended for?
It's recommended for JavaScript developers, especially those working in smaller teams or as solo programmers, who need a detailed and easy-to-use debugger within the Brackets code editor environment.
Pros:
- Allows for fast rewrites and tracing
- Can easily see how many times a function was called
- Highlights errors and makes optimization easier
Cons:
- Better for smaller dev teams and solo programmers
Pricing: It is free and is released under MIT License.
Download: Click here to download Theseus.
3. JSHint
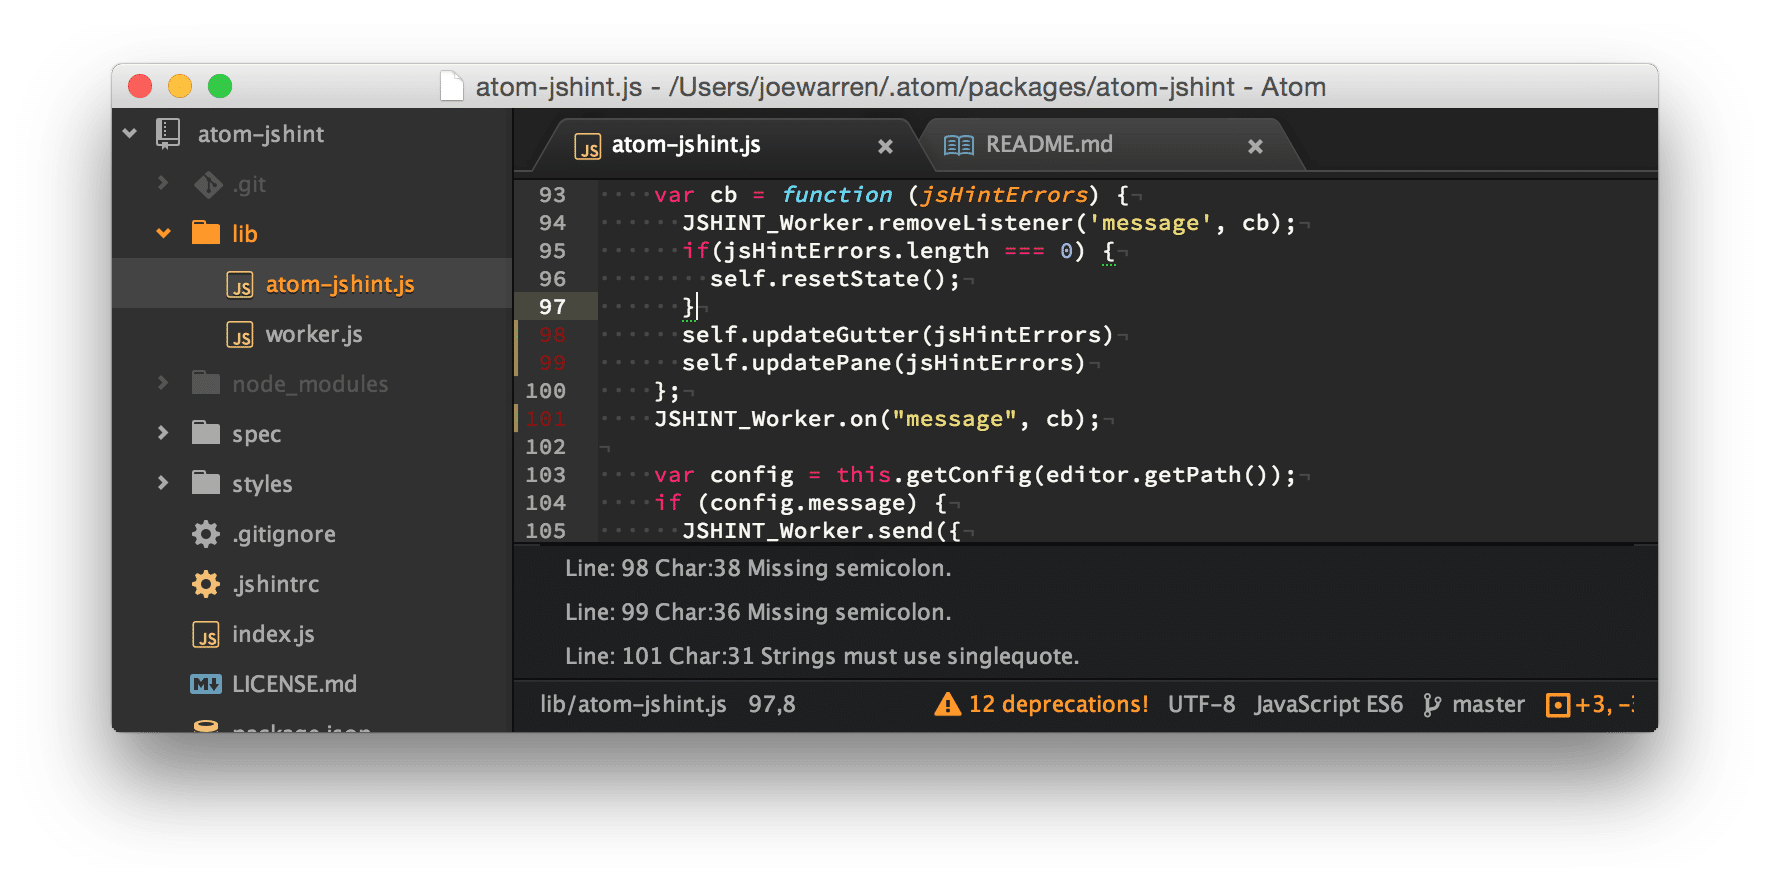 JSHint is a static code analysis tool that helps detect errors and other potential problems in your JavaScript code. It also checks if your code complies with the prevailing rules of software development. It consists of a library and a CLI program that's distributed as a Node module.
Key Features:
- Highly configurable and enables you to set various options such as bitwise operators, curly braces, camelcase, and more.
- It can be configured as a JavaScript module or as a CLI through Node.js
- Scans a program written in JavaScript and reports the typical bugs and errors.
- Note that JSHint doesn't know flag memory leaks.
- Easy to install, as you can do it with the “npm” command.
- Allows you to pass both files and directories for scanning.
- Comes with many options for checking specific sections of the code.
- Provides the option to change the output form. You can select XML, Unix, and even HTML formats for easy viewing.
Why do we recommend it?
JSHint is recommended for its highly configurable nature and its proficiency in detecting a wide range of errors and potential issues in JavaScript code.
Who is it recommended for?
This tool is ideal for JavaScript developers looking for a customizable and user-friendly code analysis tool that integrates well with a variety of development workflows.
Pros:
- Excellent interface – uses color well to highlight issues
- Automatically checks for compiling errors
- Highly customizable for more advanced coding workflows
- Simple and fast installation
Cons:
- Can take time to fully explore all features
Pricing: It is free and distributed under MIT License.
Download: Click here to download and install JSHint.
4. SplineTech
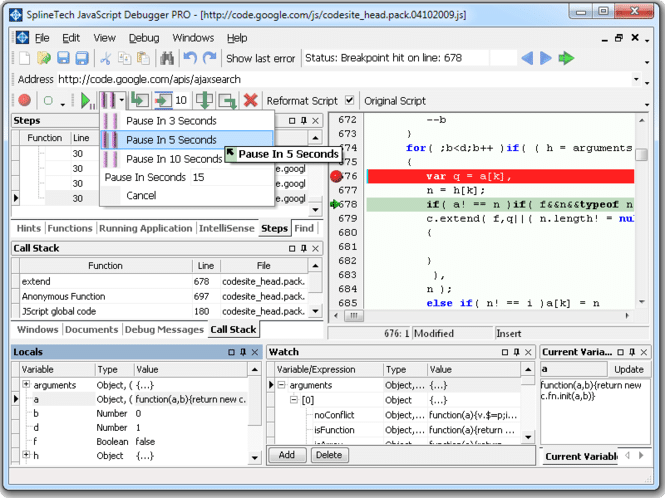
SplineTech is a standalone JavaScript editor and debugger that can be used to debug JavaScript and the VBScript code present inside HTML and DHTML pages.
Key Features:
- It is compatible only with Windows operating systems.
- Debugs JavaScript (both client and server-side), JScript, ExtJS, and JQuery events.
- Works well on both simple and complex JavaScript.
- Comes with a dockable floating window and an interactive debugging guide.
- Offers many advanced features such as call stack, local variable watch tree, and more.
Why do we recommend it?
We recommend SplineTech for its comprehensive debugging capabilities, especially for JavaScript and JScript code within HTML and DHTML pages, tailored for Windows OS.
Who is it recommended for?
SplineTech is best suited for developers working on complex JavaScript projects, requiring detailed debugging tools in a Windows environment.
Pros:
- Highly detailed and technical debugger tool
- Supports JScript, ExtJS, and JQuery events
- Includes automated and manual debugging tools
Cons:
- Interface can feel cluttered at times
Pricing: Free
Download: Click here to download SplineTech JavaScript Debugger.
5. Sentry.io
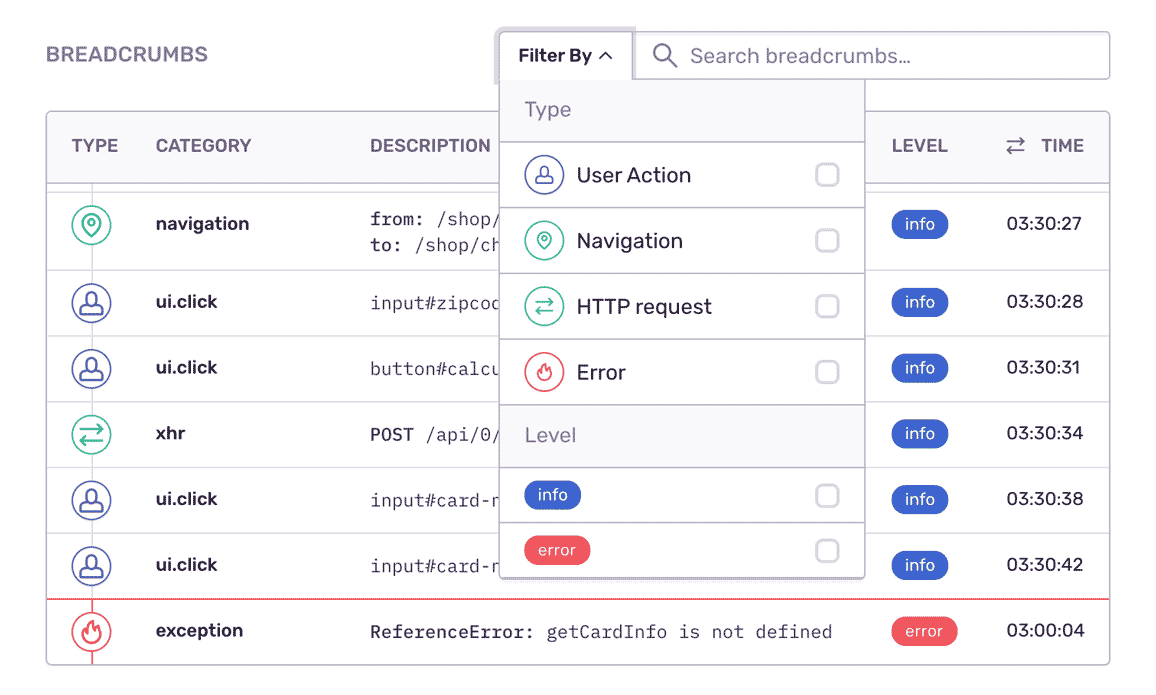
Sentry.io is an advanced JavaScript error and performance monitor that generates actionable insights into the performance points to mistakes and helps resolve them with the highest efficiency.
Key Features:
- Quickly identifies performance issues before they lead to downtime.
- Enables you to view the entire trace so that you can identify errors rapidly.
- Makes it easy to spot poor-performing API calls.
- Uses source maps to convert compiled or transpired code into its original form.
- Displays the stack trace that can be otherwise be seen in the debug console only.
- Provides information about user interactions, AJAX requests, console log messages, and more.
- Records the environment and usage details to enable you to recreate the bugs accurately.
- Stores session-specific information such as OS and query bugs.
- Isolates and prioritizes errors within a context.
Why do we recommend it?
Sentry.io is highly recommended for its ability to rapidly identify performance issues and provide actionable insights, enhancing the efficiency of error resolution.
Who is it recommended for?
It's particularly beneficial for smaller teams looking for a robust monitoring solution across various programming languages, with a focus on server health and root cause analysis.
Pros:
- Dedicated to monitoring various languages, good for companies that already have other app monitoring tools they’re happy with
- 100+ alerts and templates customized around server health monitoring
- Supports root cause analysis for faster resolution times
- Includes workflows for better root cause analysis
Cons:
- Better suited for smaller teams
Pricing:
Sentry.io offers four pricing plans, and they are:
- Developer – Free. Offers only limited error and performance monitoring.
- Team. $26 per month. Provides core error and performance monitoring with flexible event volume.
- Business. $80 per month. Offers standardized error and performance monitoring with insights powered by Discover.
- Enterprise. This is a complete platform monitoring with cross-project insights. Click here to request a demo.
Download: Click here to try Sentry for free.
6. Postman
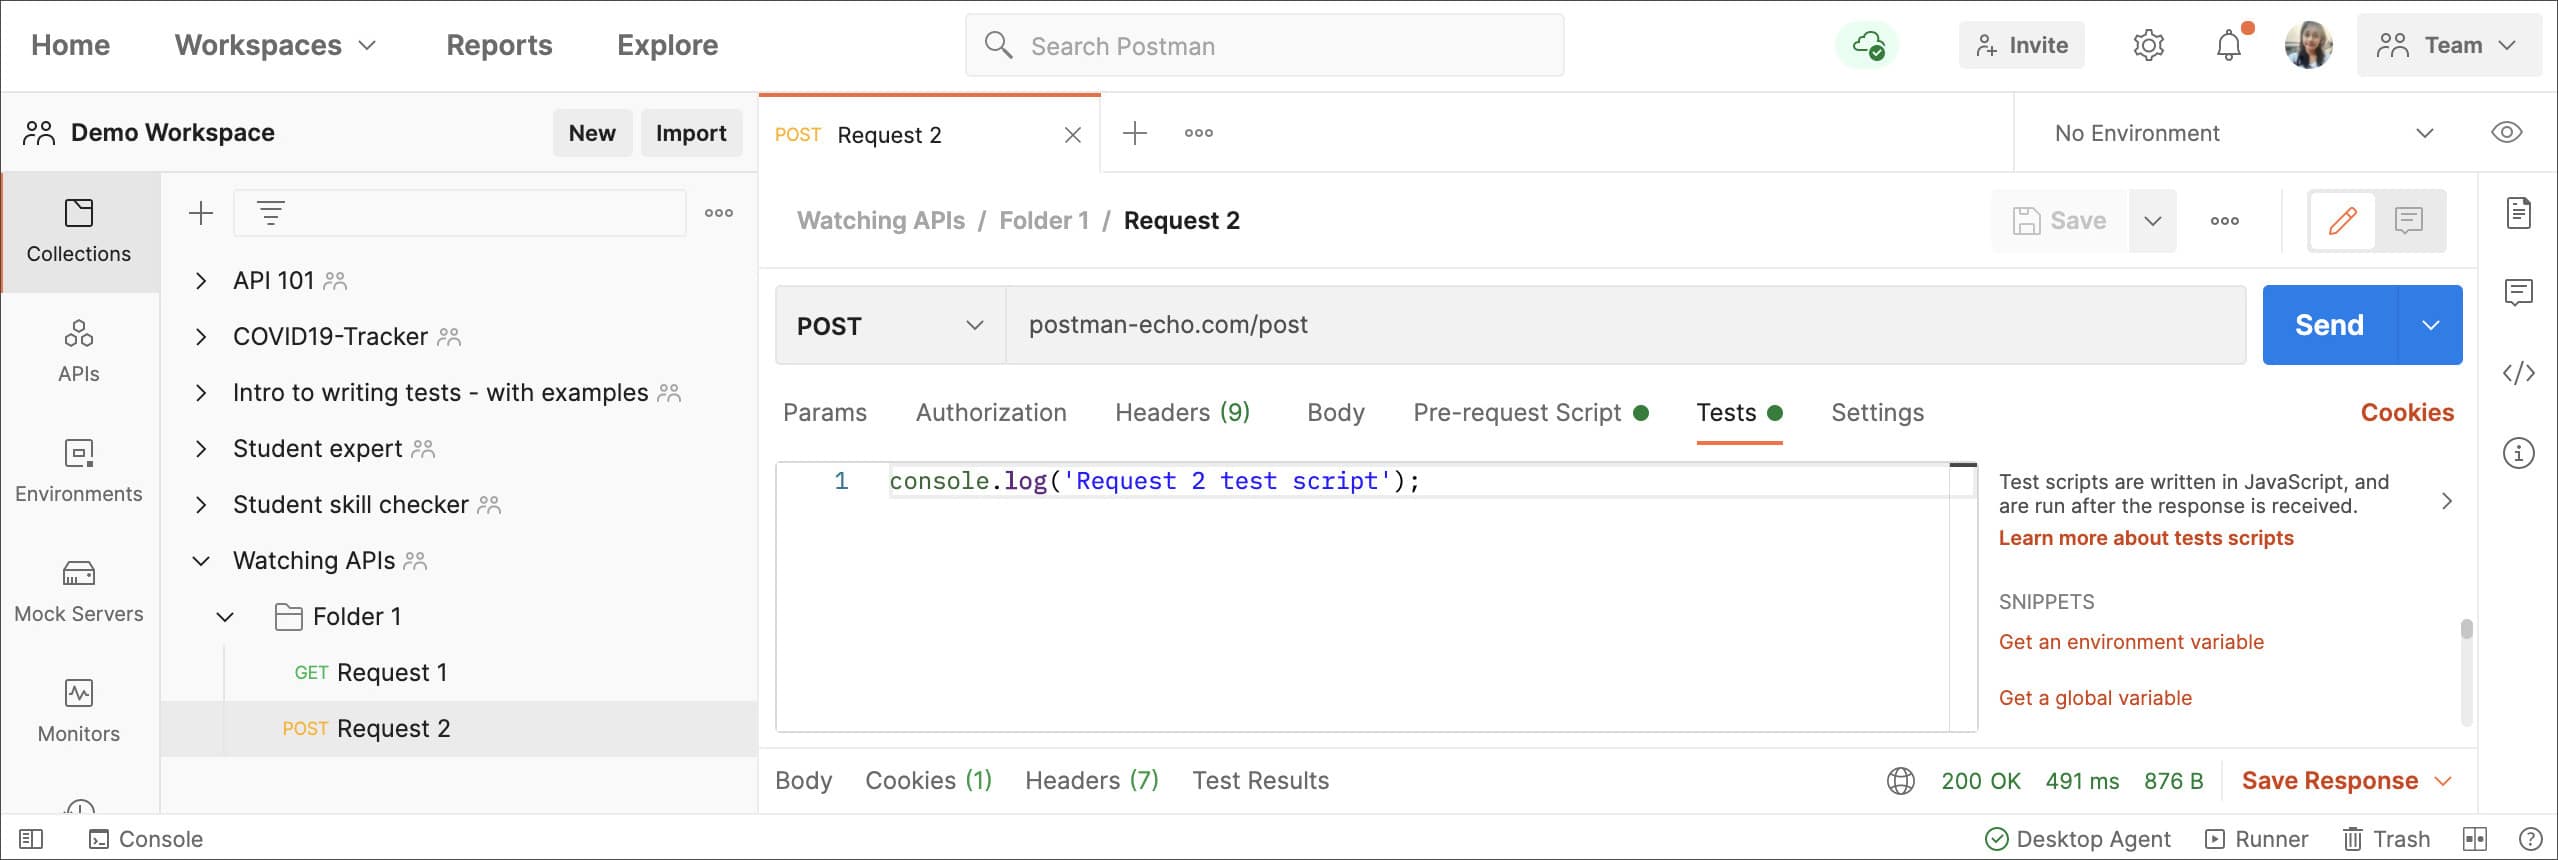
Postman is a popular JavaScript debugger that troubleshoots the requests and responses in your application.
Key Features:
- Works well on Windows, macOS, and Linux systems.
- Enables you to tweak requests and analyze problems.
- Supports the debugging of problems.
- Makes it easy to create “clean” transactions that, in turn, can be replicated within your application.
- Allows you to save sets of requests and responses of your APIs through a feature called Collections.
- Supports collaboration among team members.
- Works well for repetitive testing tasks.
Why do we recommend it?
Postman is recommended for its comprehensive capabilities in debugging requests and responses in applications, supported by a large and active community.
Who is it recommended for?
It's ideal for developers at all skill levels, especially those working in collaborative environments, needing a tool for repetitive testing and API monitoring.
Pros:
- Completely free
- Large supportive community with over 10 million users
- Allows for alerts to be setup through a simple workflow
- Integrates well with popular tools such as Slack, and PagerDuty
- Has a paid team version for more collaboration features that starts at $12.00
Cons:
- Can be quite technical for new users
Pricing:
Postman offers four plans, and they are:
- Free – Supports up to three members.
- Team – $12 per user per month. Allows up to 10 integrations and a 10x increase in API usage limit over the free plan.
- Business – $24 per user per month. Along with features of the Team plan, you get a 10x increase in API usage limit, 50 integrations, and single sign-on through SAML.
- Enterprise – $69 per user per month. All the features in Business plus 1000x Postman API usage limits, 100 integrations, advanced reporting and analytics, and more.
Download: Click here to get started.
7. ESLint
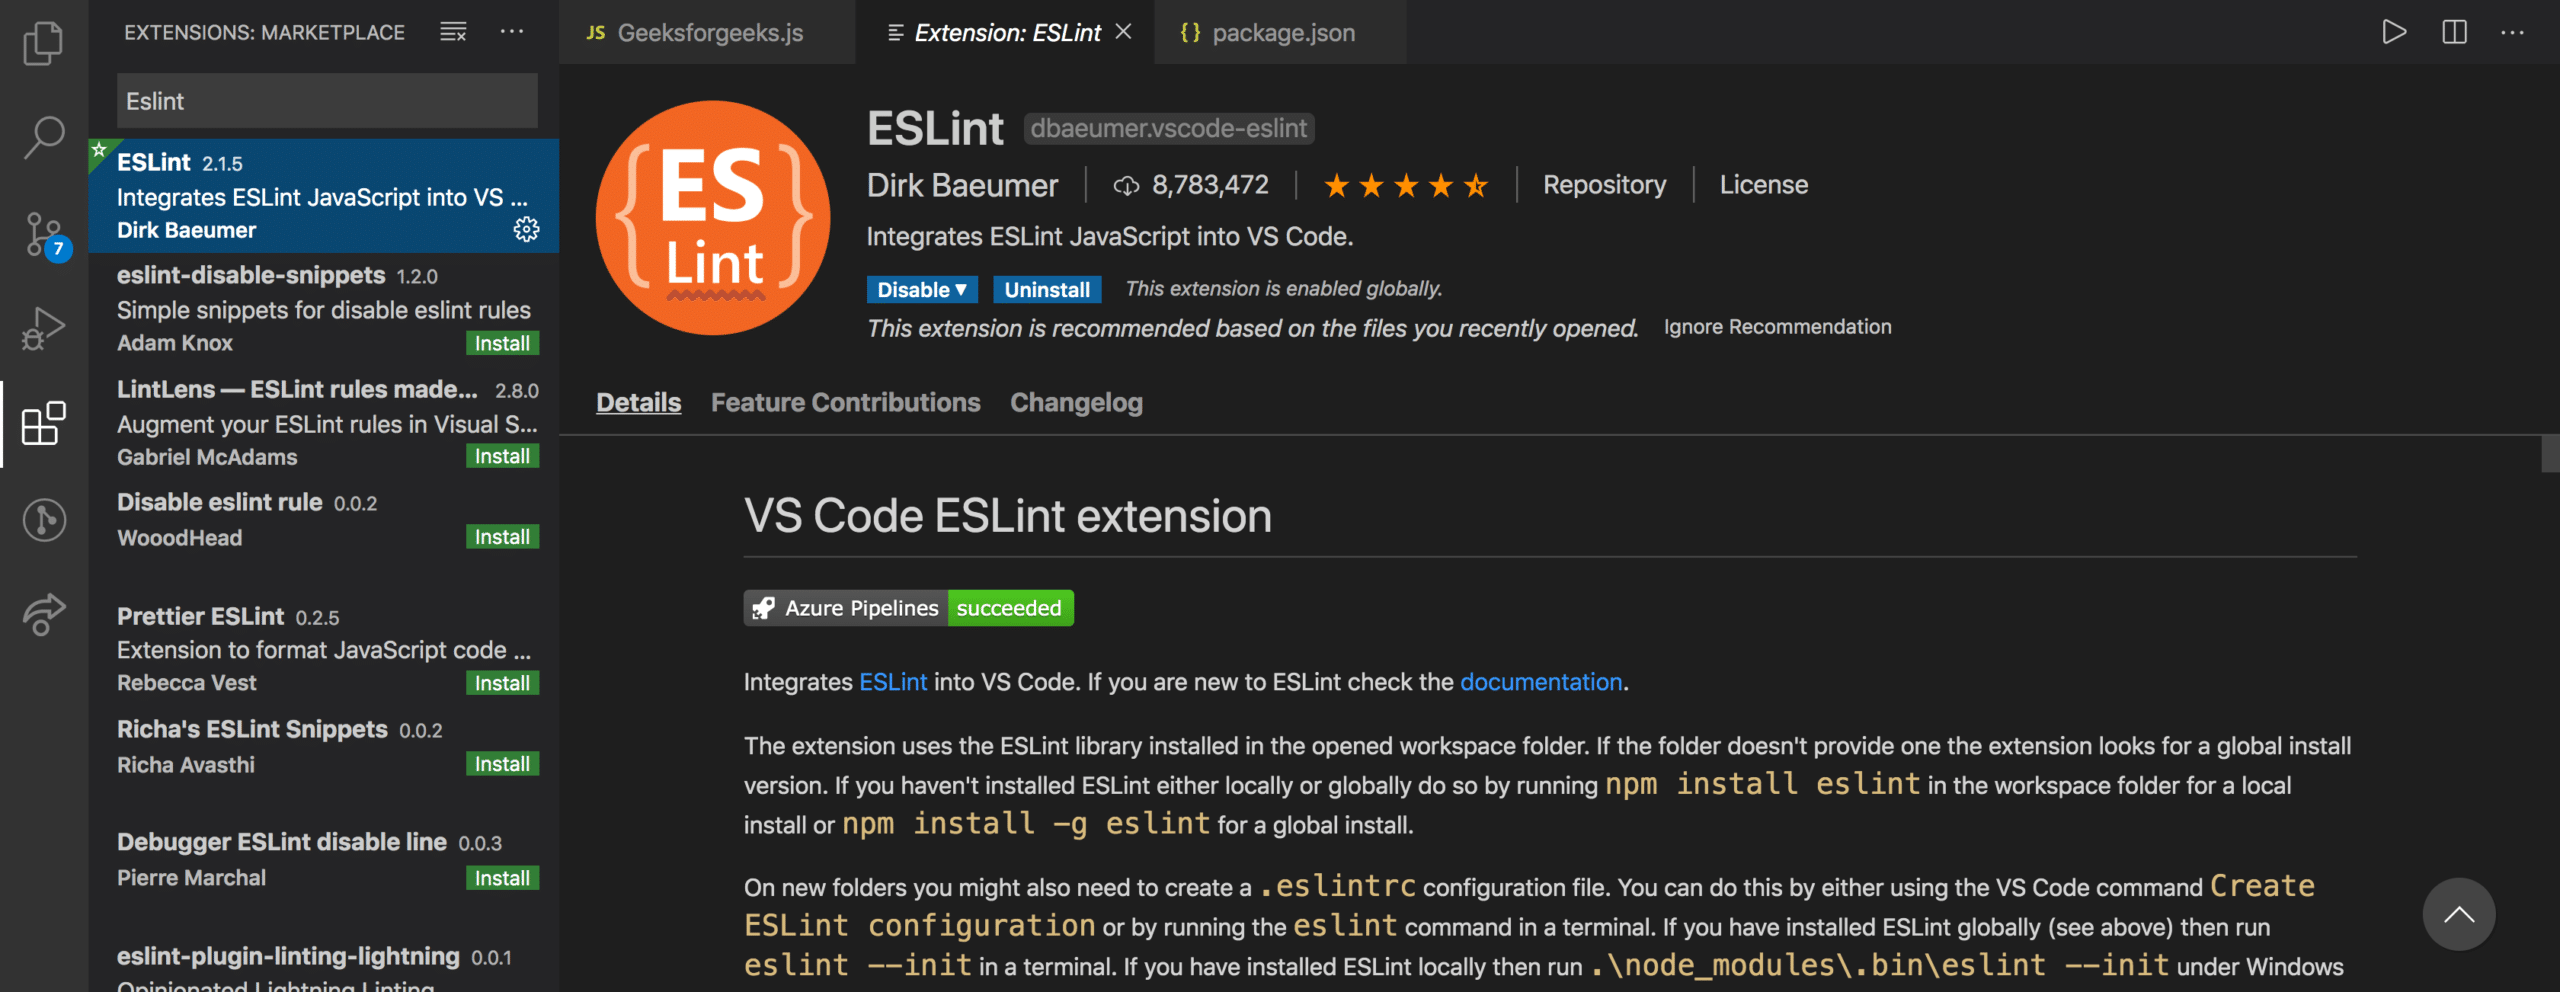
ESLint is an advanced linter for JavaScript that analyzes your code as you type and identifies errors in syntax, and catches typos. This tool eliminates some of the annoying yet straightforward and hard-to-find errors such as brackets and typos.
Key Features:
- Statistically analyzes your code to identify errors.
- It is built into most text editors to integrate it as a part of your development pipeline.
- Avoids find and replace problems and complications.
- Enables the preprocessing of your code.
- Supports custom parsers.
- Provides the flexibility to write your own rules that work in addition to ESLint's built-in rules, so all possible errors are identified and fixed right away.
- Requires Node.js for proper functioning.
- Works well on Windows, Mac, and Linux.
Why do we recommend it?
ESLint is a top choice for its effectiveness in statistical code analysis and its flexibility in integrating with most text editors for streamlined bug fixes.
Who is it recommended for?
This tool is well-suited for developers across various platforms who need a customizable linter with the capability to write their own rules for enhanced error detection.
Pros:
- Uses statistical analysis to find errors
- Preprocesses your code for more streamlined bug fixes
- Great user interface
- Cross-platform with Windows, Linux, and macOS
Cons:
- Can take time to fully explore all features offered
Pricing: Free, though you can become a sponsor or donate.
Download: Click here to get started.
8. JSBin
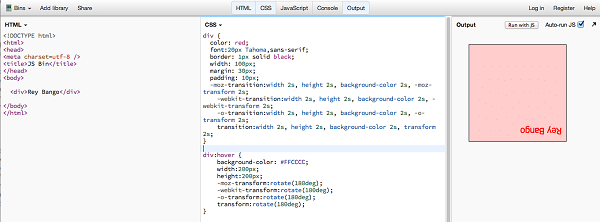
JSBin is a collaborative JavaScript tool that allows you to test and debug JavaScript code with others. It is simple to use and highly flexible.
Key Features:
- Supports live reload both in the editor and in full preview.
- Provides the option to archive or even delete code bins.
- Makes it easy to run the JavaScript code and see the output on the debug console.
- Allows you to test a small piece of JavaScript code in an isolated environment.
- There is no impact from conflicting code running in other parts of your application.
- Enables you to see changes in real-time.
- Supports custom templates and default preferences that can be changed at any time.
- Comes with many advanced features such as drag and drop editing, keyboard shortcuts, SSL embeds, code clones, sandbox mode, private hosting, asset hosting, vanity URLs, and more.
Why do we recommend it?
JSBin is recommended for its simplicity and flexibility, making it an excellent tool for testing and debugging JavaScript code in a collaborative environment.
Who is it recommended for?
It's best for small teams and individual developers looking for an open-source, lightweight tool to quickly test small segments of JavaScript code.
Pros:
- Extremely lightweight tool
- Includes a Dropbox sync integration
- Best for small teams and projects
- Completely open source
Cons:
- Limited features compared to competing products
- More of a budget tool
Pricing: JSBin's PRO version is priced at £99.99 per year or £12.99 per month.
Download: Click here to run your JavaScript code in the free version.
9. Raygun
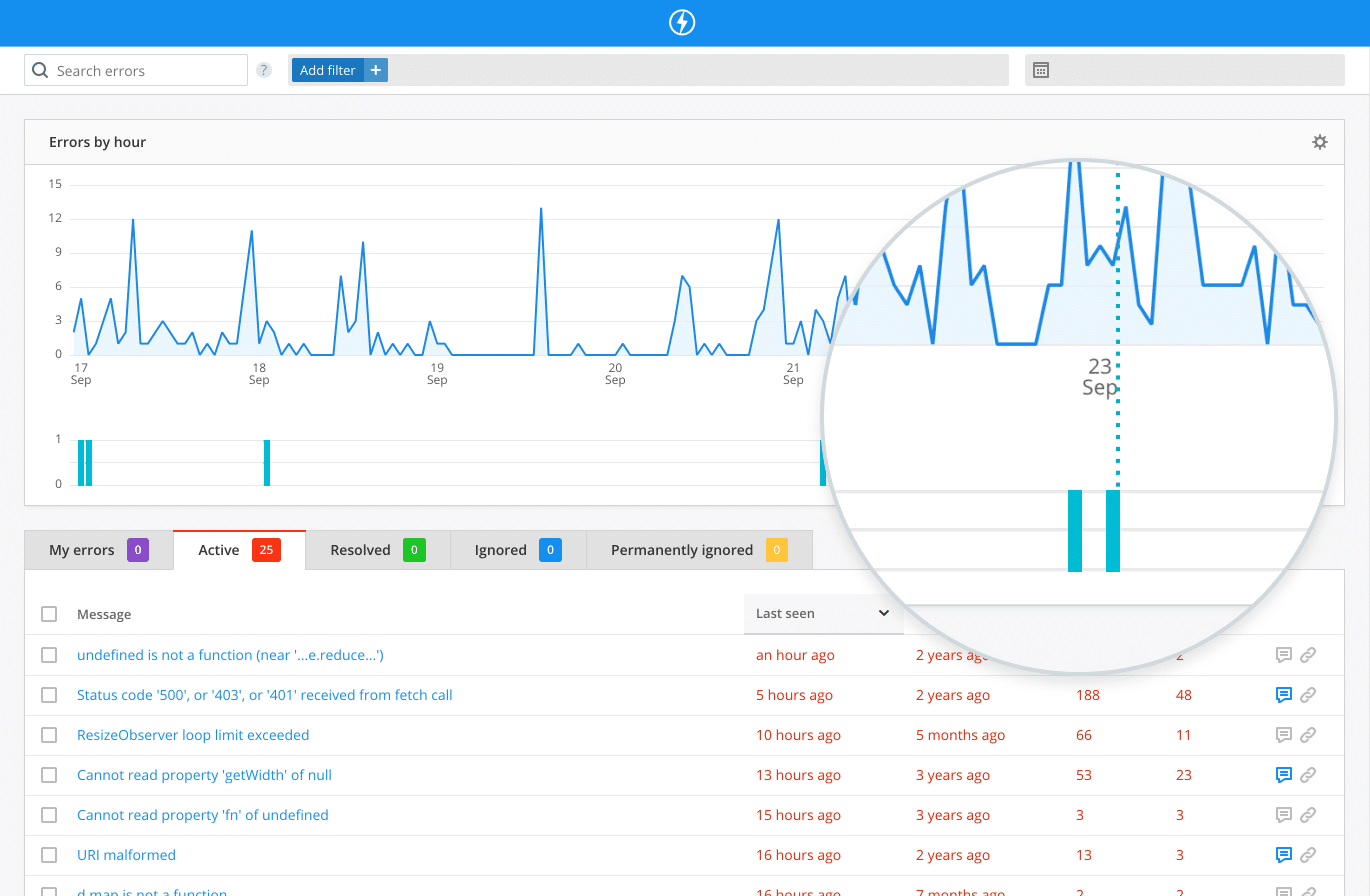
Raygun is a crash monitoring tool that enables you to detect errors and resolve them at the earliest.
Key Features:
- Provides code-level insights in real-time.
- Enables you to identify and fix errors before they impact the end-users.
- Provides complete visibility into your entire tech stack.
- It is easy to set up, as it requires just a few lines of code and the installation of lightweight SDKs.
- Avoids the hassles of searching through logs.
- Provides deep insights into the root cause of errors and crashes.
- Monitors deployments in real-time.
- Connects to source code repositories like GitHub with native integrations.
- Prioritizes errors that have the most significant impact on end-users.
- Uses smart filtering to segment errors through different filters such as data, location, and more.
- Adds contextual information where required.
- Generates detailed reports.
- Reduces MTTR greatly.
- Sends real-time alerts through Slack, so it is easy to track their response and assign responsibility to users.
- Integrates well with popular tools like Jira and Zendesk.
Why do we recommend it?
Raygun is recommended for its efficient crash reporting and user monitoring capabilities, offering detailed insights into errors and improving overall tech stack visibility.
Who is it recommended for?
It's particularly suited for scenarios focusing on real user monitoring, where quick identification and resolution of errors are crucial for maintaining application stability.
Pros:
- Simple visual debugger
- Offers crash reporting and bug feedback
- Supports user monitoring
Cons:
- Better suited for real user monitoring use cases
Pricing
Raygun comes in three pricing plans, namely,
- Crash reporting – $4 per month per 10,000 reserved events.
- Real user Monitoring – $8 per month 10,000 reserved events
- APM – $8 per month per 10,000 reserved traces.
Download: Click here for a free trial.
Thus, these are some of the best tools to monitor and debug JavaScript code.
Conclusion
JavaScript is one of the most popular scripting languages today, and it is an integral part of many web applications and websites. Since it is a critical part of an application's performance and reliability, it is essential to test the code, identify errors, and fix them at the earliest before they start impacting the end-users.
The tools mentioned above (both paid and free) make it easy to detect errors and fix them. We hope this was helpful for you to identify the right tool for your business.
JavaScript Monitoring & Debug Tools FAQs
What are some common tools for JavaScript monitoring?
Some common tools for JavaScript monitoring include New Relic, Dynatrace, AppDynamics, and Datadog. These tools offer real-time monitoring, analytics, and visualization of JavaScript performance metrics.
What metrics are important to monitor for JavaScript?
Important metrics to monitor for JavaScript include load times, error rates, memory usage, CPU usage, and network requests. These metrics can provide insight into the performance of JavaScript code and help identify areas for optimization.
How does JavaScript monitoring work?
JavaScript monitoring typically involves adding monitoring code to web pages or web applications. This code tracks performance metrics and sends them to a monitoring platform for analysis and visualization.
Can JavaScript monitoring be automated?
Yes, JavaScript monitoring can be automated using tools like Selenium or Puppeteer. These tools can simulate user interactions with web pages or applications and capture performance metrics.
How does JavaScript monitoring integrate with other monitoring tools?
JavaScript monitoring can be integrated with other monitoring tools, such as application performance monitoring (APM) or server monitoring tools. This allows for a more comprehensive view of application performance and can help identify issues that are caused by JavaScript code.
How do I get started with JavaScript monitoring?
To get started with JavaScript monitoring, you can explore some of the tools and platforms that are available, such as New Relic, Dynatrace, AppDynamics, or Datadog. You can also start by identifying the key metrics that are important to monitor for your web applications and begin adding monitoring code to track those metrics.

